
Figure 2A/B:
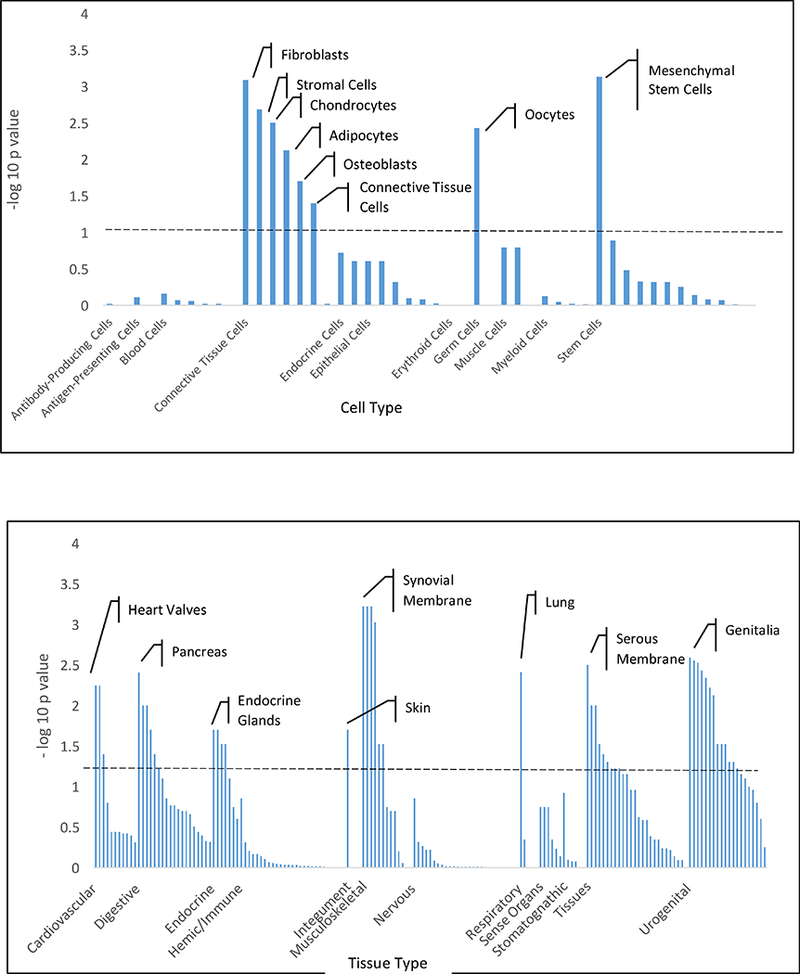
Tissue and cell type enrichment analysis. Plots showing the enrichment of loci associated with diverticular disease (p < 1 × 10⁻⁵ in the UKBB; N=27,444 cases/382,284 controls) in specific cell types (A) and tissues (B). Enrichments are grouped according to system or cell type and significance; annotations above the dashed line have FDR ≤ 0.20. Data corrected for multiple comparisons using Benjamini-Hochberg method. Top tissue in each category labelled.