TABLE 1.
Se metabolites idenfied from human urinary and serum.
| Se metabolite | Structure | Monoisoto pic mass |
Baseline abundance |
Response | Ref |
|---|---|---|---|---|---|
| TMSe (trimethylselenoniu m ion) |

|
124.987 | -Trace in urine and serum. -Varied between TMSe producers (major) and non-TMSe producers (minor or non- detectable) in urine |
-Increase as a minor urinary product after SeMet supplement -Increase moderately in urine after selenite supplement -Minor product in urine |
[106, 180, 181] |
| Selenosugar 1 (methyl-2- acetamido-2-deoxy- 1-seleno-b-D- galactopyranoside) |
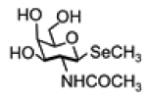
|
299.027 | -Small amount in urine and serum -Major metabolite in urine non-TMSe producers -Major urinary metabolite |
-Increase to the major product after SeMet treatment -Respond strongly to SeMet treatment as the major metabolite |
[102, 180, 181] |
| Selenosugar 3 (methyl-2-amino-2- deoxy-1-seleno-b-D- galactopyranoside) |
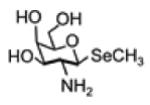
|
257.0164 | -Small amount in urine and serum -2nd major metabolite in non- TMSe producers -Major metabolite |
-Increase to the 2nd major product after SeMet treatment -Increase moderately after selenite supplement |
[106, 180, 181] |
| SeMet (selenomethionine) |
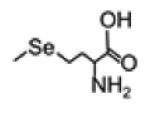
|
196.9955 | -Below detection limit in serum and urine |
-Increase after L- SeMet supplement; - No response to other supplement |
[180, 181] |
| SeMSC (Se-methyl- selenocysteine) |
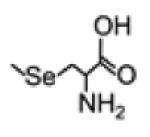
|
182.9799 | -Expected but not detected |
-Trace in serum. Increase in Se excreted in urine after supplementat ion with SeMSC |
[182] |
| Selenite |
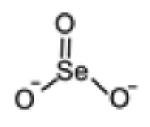
|
127.9013 | -Low amount in serum -Below detection limit in urine |
-Unchanged in serum -Below detection limit in urine |
[106, 180] |
| Selenate |
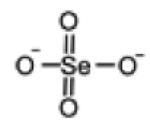
|
143.8962 | -Below detection limit in urine |
-Increase moderately after selenite supplement in urine |
[106] |
| Selenocystathionine |

|
270.0119 | -detected not quantified in the urine |
-Increased in epithelial ovarian cancer |
[183] |
| Selenocystine |

|
335.9128 | -detected and quantified in the serum |
-decrease in cystic fibrosis patients compared to healthy controls |
[184] |
