
Figure 3.
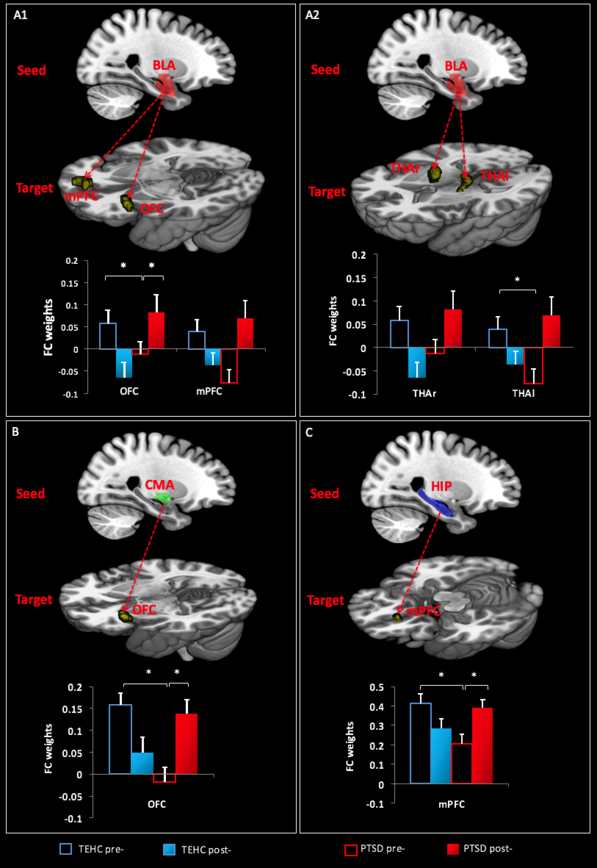
Group-by-time interactions regarding functional connectivity of: (A1) BLA (red cluster)-mPFC and -OFC; (A2) BLA (red cluster)-THA (right and left); (B) CMA (green cluster)-OFC; and (C) Hippocampus (HIP; blue cluster)-medial Prefrontal cortex (mPFC). Arrows represent rsFC between seeds and target regions (yellow clusters). The y-axis represents rsFC strength. Corrected p<0.05.