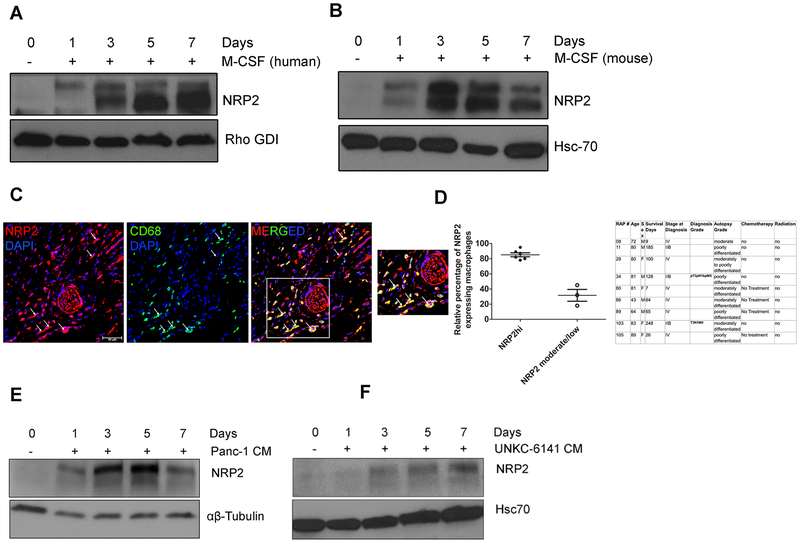
Figure 1. Expression of NRP2 in macrophages.
(A, B) NRP2 expression in freshly isolated human monocytes and bone marrow cells from C57BL/6 mice differentiated to macrophages with M-CSF. (C) Representative confocal image showing the presence of NRP2 expressing CD68+ TAMs in human PDAC tissue. The first panel shows only NRP2 positive cells (red). The second panel shows CD68+ macrophages (green). The third panel represents merged image showing NRP2+CD68+ macrophage in the tumor. Scale bar, 20μm. Inset shows magnified image of part of the tissue. Dapi was used to stain the nucleus. (D) Graphical representation showing relative abundance of NRP2+ macrophages in a cohort of treatment naïve PDAC tissues derived from RAPP. Table shows details of patient tissues procured. (E, F) Immunoblot analyses showing NRP2 expression in human and mouse macrophages differentiated with pancreatic cancer cell line-derived Conditioned medium (CM) from Panc-1 or UNKC-6141 cells respectively in vitro.

