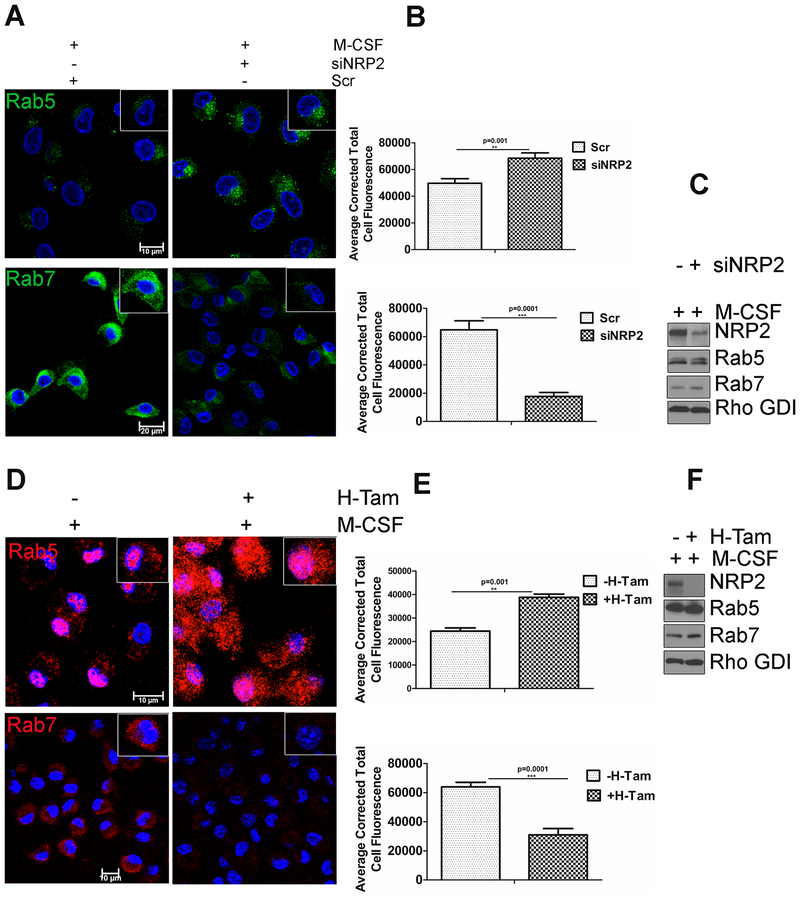
Figure 3. Effect of NRP2 on early and late phagosomes.
Knockdown or deletion of NRP2 inhibits maturation of early to late phagosomes in macrophages. (A) Immunostaining of early and late phagosomal maturation markers in human macrophages following NRP2 knockdown. The upper panel represents early phagosome marker Rab5 (green). Scale bars 10μm. The lower panel shows representative the late phagosomal marker Rab7 (green). Scale bars 20μm. Magnified images of individual cell are shown in the inset for each condition. (B) Immunostaining data for Rab5 and Rab7 were quantified as cellular fluorescence using Image J software and represented graphically. The upper and lower panels show graphical representation of Rab5 and Rab7 respectively, in the presence and absence of NRP2. (D) Immunostaining of early and late phagosomal maturation markers in mouse BMDM following NRP2 deletion. The upper and lower panels represent early phagosome marker Rab5 (red) and the late phagosomal marker Rab7 (red) respectively. Scale bars 10μm. The insets are magnified image of individual cell for each condition. (E) Representative bar graphs showing quantification of Rab5 and Rab7 using Image J software. The upper and lower panels represent changes in Rab5 and Rab7 respectively, following NRP2 deletion. All values are shown as mean ± SEM. Dapi was used for staining the nucleus. (C,F) Western Blot showing total cellular Rab5 and Rab7 in whole cell lysates from human and mouse macrophages following knockdown or knockout of NRP2 respectively.

