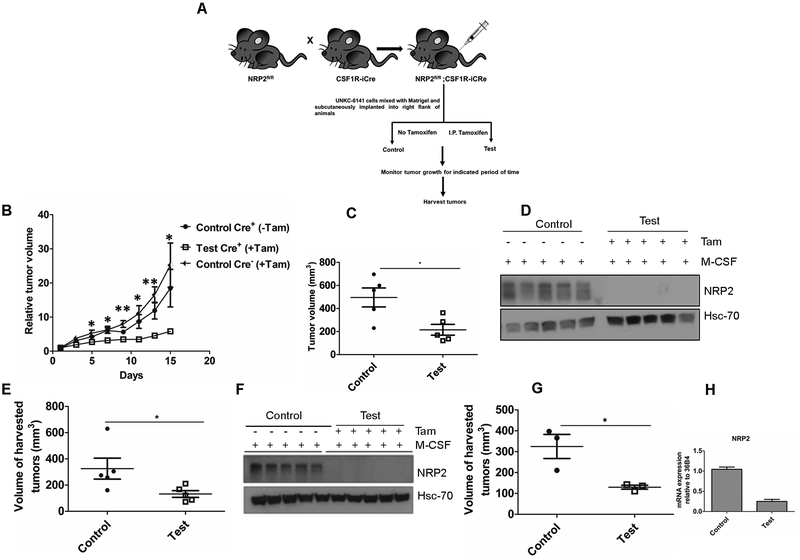
Figure 5. NRP2 in macrophages affects tumor growth.
(A) Schematic diagram for subcutaneous tumor progression model. 2×10⁶ or 500,000 UNKC-6141 cells were subcutaneously implanted into NRP2fl/flCSF1R-iCre mice. Tumor progression was monitored for the indicated time periods. (B) Graph showing relative tumor volume for control and test tumors (2×10⁶ cells implanted). (C) Scatter plot representation of the final volume of the harvested tumors (2×10⁶ cells implanted). (D,F) Immunoblot analysis showing efficient knock out of NRP2 from macrophages for experiment B and E. (E, G) Graphical representation of final volume of harvested tumors (n=3 or 5, 500,000 cells implanted). (H) RT-PCR showing efficient knock out of NRP2 from CD11b+ myeloid cells isolated from test tumors for G.

