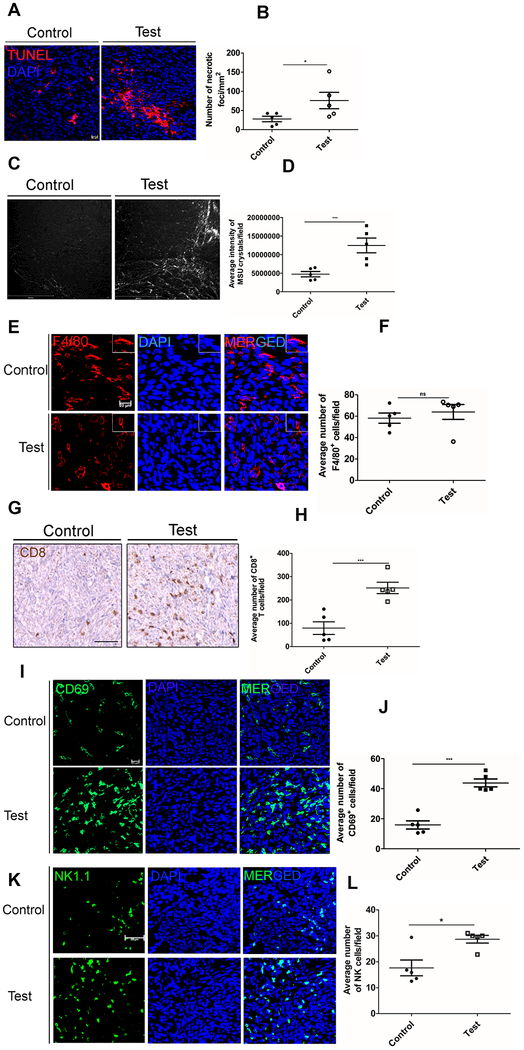
Figure 6. NRP2 in TAMs regulates the efferocytosis of apoptotic tumor cells and immune responses.
(A) Representative image showing TUNEL+ cells in control and test tumors. (B) The number of necrotic foci relative to tumor volume shown graphically. (C) Representative images showing deposition of MSU crystals in control and test tumors. Scale bar, 500 μm. (D) Scatter plot comparing the formation of MSU crystals in control versus test tumors. (E) Representative image showing role of NRP2 in the migration of macrophages (F4/80+, red) to the tumor. Scale bar, 20μm. Inset shows magnified image of a single F4/80+ macrophage. (F) the number of F4/80+ cells per field were counted using Image J software and represented graphically. (G) Representative immunohistochemistry image showing CD8+ T cell infiltration in control and test tumors. Image Scale, 20× magnification. (H) Number of CD8+ T cells per field was counted using Image J software, and represented graphically. (I) Representative confocal microscopy image for CD69+ T cell infiltration (green) in the control and test tumors. Scale bar 20μm. (J) Number of CD69+ T cells per field was counted using Image J software and represented as a scatter plot. (K) Representative confocal microscopy image for NK1.1+ cells (green) in control and test tumors. Scale bar 20μm. (L) Number of NK1.1+ cells per field was counted using Image J software, and represented graphically. Dapi was used to stain the nucleus. All values are mean± SEM.

