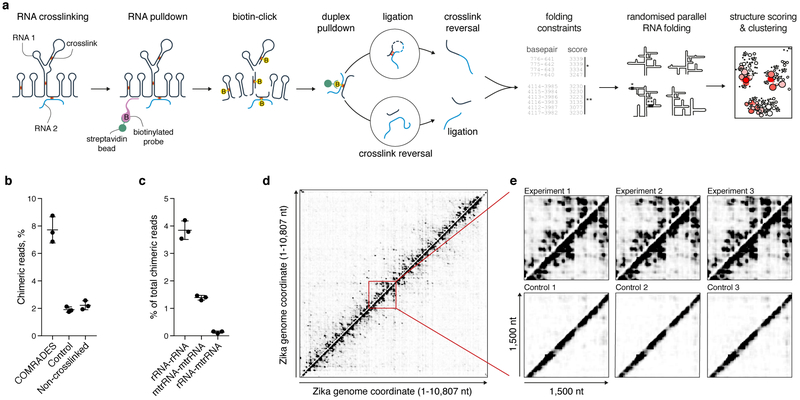
Fig. 1: COMRADES methodology.
a, Outline of COMRADES experimental workflow and the associated computational pipeline. B: biotin. b, % of chimeric reads in COMRADES and control datasets. Mean and s.d. of 3 independent experiments are shown. c, Probed interactions among cytoplasmic and mitochondrial ribosomal RNA subunits. Mean and s.d. of 3 independent experiments are shown. rRNA: cytoplasmic ribosomal RNA; mtrRNA: mitochondrial ribosomal RNA. d, Heat map of ZIKV RNA-RNA interactions. Each dot represents an interaction between the genomic coordinates on the x and y axes. Chimeras ligated in 5'-3' and 3'-5' orientations are plotted above and below the diagonal respectively. e, Zoom-in on a selected 1,500 nt region from (d).

