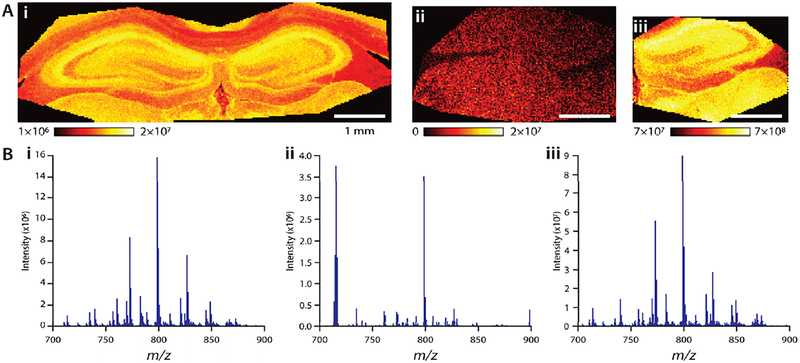
Figure 2.
Influence of conducting IR spectroscopic imaging on the quality of MALDI MSI data. (A) MALDI MS ion image of the hippocampus (m/z 798.5407; [PC 34:1 + K]+) for (i) MaLDI MS performed prior to IR spectroscopic imaging, (ii) after IR analysis with identical conditions - left side of brain section was analyzed, and (iii) right side of the same tissue section as in (ii) with twice the laser power and number of laser shots. (B) Average, RMS normalized spectra for each image.

