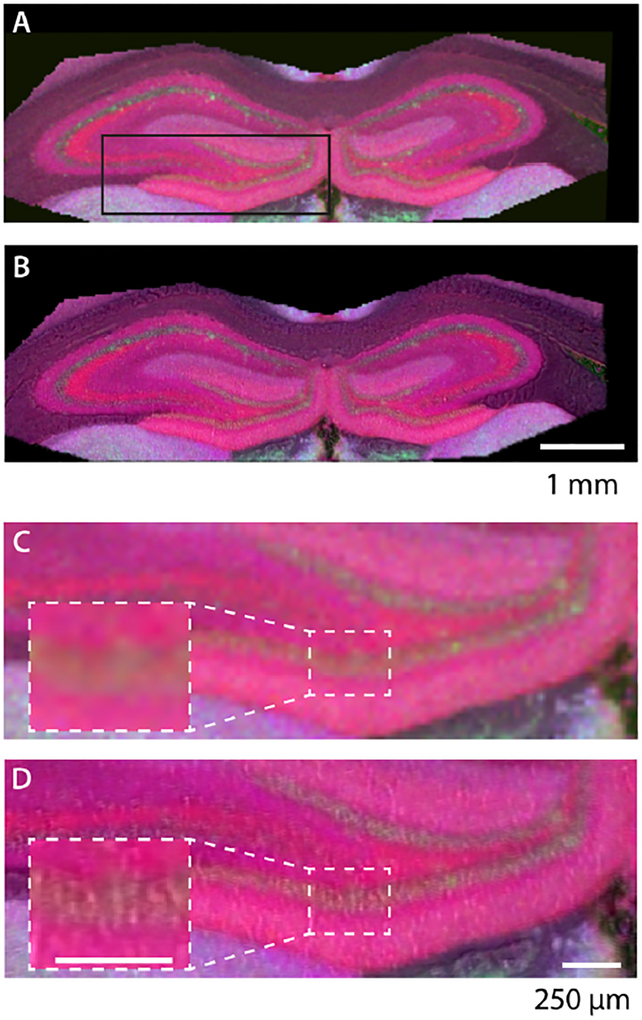
Figure 4.
RGB composite ion image: R = [PC 32:0 + K]+ (m/z 772.5253), G = [PC 40:6 + K]+ (m/z 872.5566), and B = [PC 34:0 + k]+ (m/z 800.5567). (A) Unsharpened MS image of the hippocampus taken with MSI at 25 μm spatial resolution. (B) MS image in A, sharpened with QCL-IR band at 1656 cm−1. (C) Magnification of the area marked in A containing an unsharpened MS image of the DG (magnified inset) and one end of the CA3 region. (D) Magnification of sharpened MS image shown in B.

