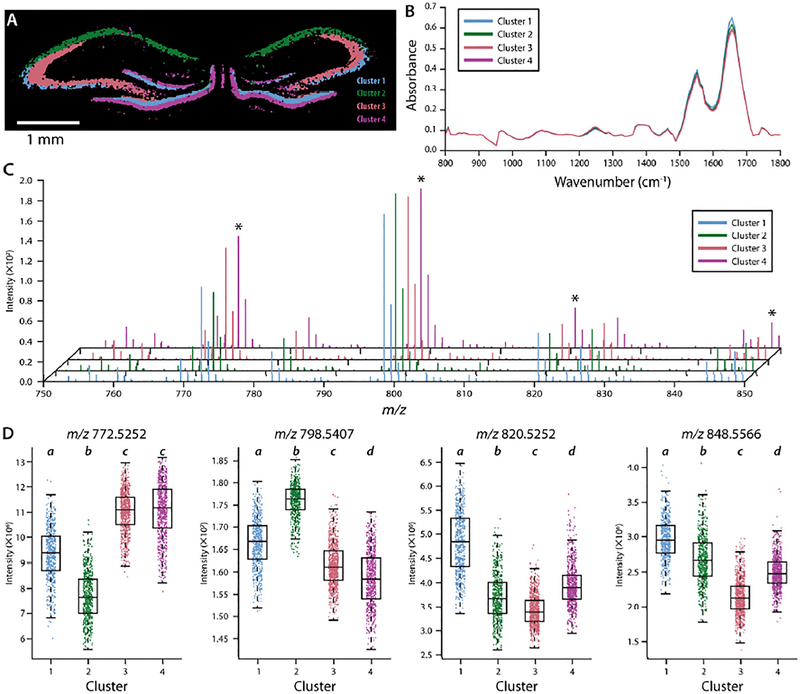
Figure 6.
Results of k-means clustering of fused data sets. (A) Segments associated with the CA1 (blue), lucidum layer of CA3 (pink), rest of CA3 (green), and the DG (purple) layers within the hippocampus. (B) Average absorbance spectra for the four clusters. (C) Average mass spectra for the specified clusters. Asterisks denote the m/z values used for the 4 boxplots presented in D. (D) Boxplots of selected signal intensities within each highlighted cluster. Boxplots for corresponding salt adducts can be found in Figure S15. Labels above each box denote significantly different groups by post-hoc Tukey’s honestly significant difference multiple comparison test.

