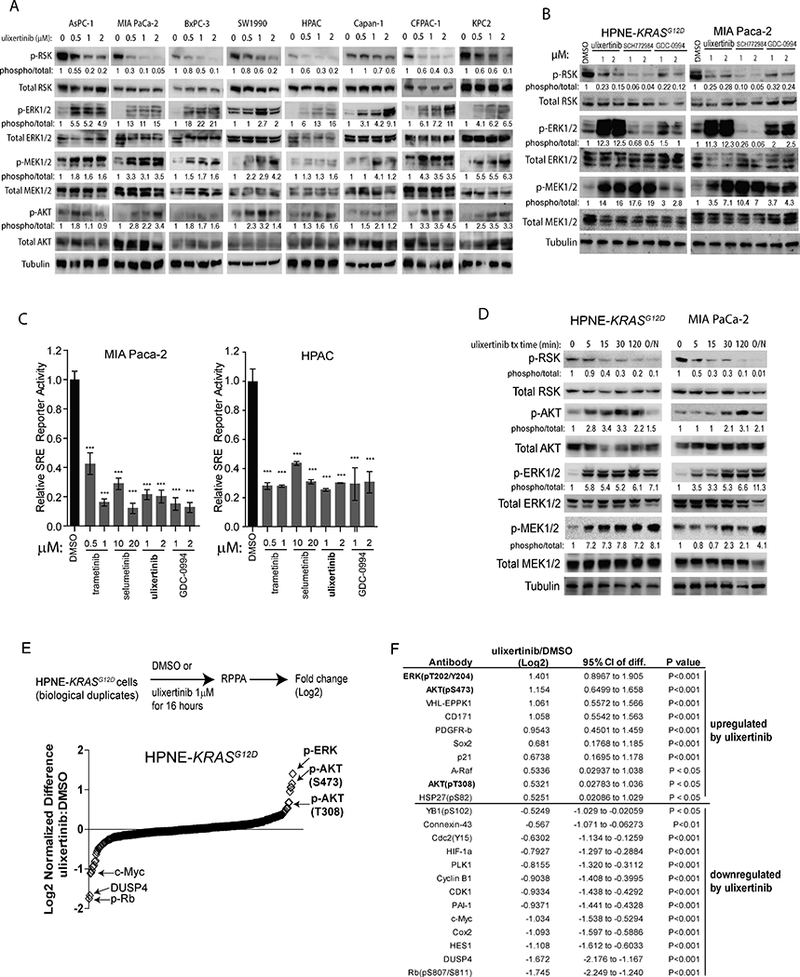
Figure 3. Pharmacologic ERK inhibition increased ERK, MEK and AKT phosphorylation.

A, Western blots showing the effect of ulixertinib at different concentrations on the indicated PDAC lines after overnight (~16 hours) treatment. B, Western blots showing the effect of three different ERK inhibitors on MIA Paca-2 and HPNE-KRASG12D cells following overnight treatment. The indicated numbers represented relative densitometric intensity of each band measured by ImageJ software. C, SRE-driven luciferase reporter assay of MIA Paca-2 and HPAC cells showing the effect of MEK or ERK inhibitors on SRE activity levels as normalized to internal Renilla, after overnight treatment. One of three sets of experiments, each done in triplicates, was presented. D, Western blots showing time course changes in the intensity of the indicated proteins, measured by densitometry, in two different PDAC lines, following ulixertinib treatment. E, Graphical representation of RPPA data showing the quantitative changes in ulixertinib/DMSO ratio across all tested markers from HPNE-KRASG12D cells treated with ulixertinib 1μM or DMSO for 16 hours in biological duplicates. F, List of RPPA markers with intensity changes more than one-fold and meeting p<0.05 after ulixertinib treatment, compared to DMSO.
