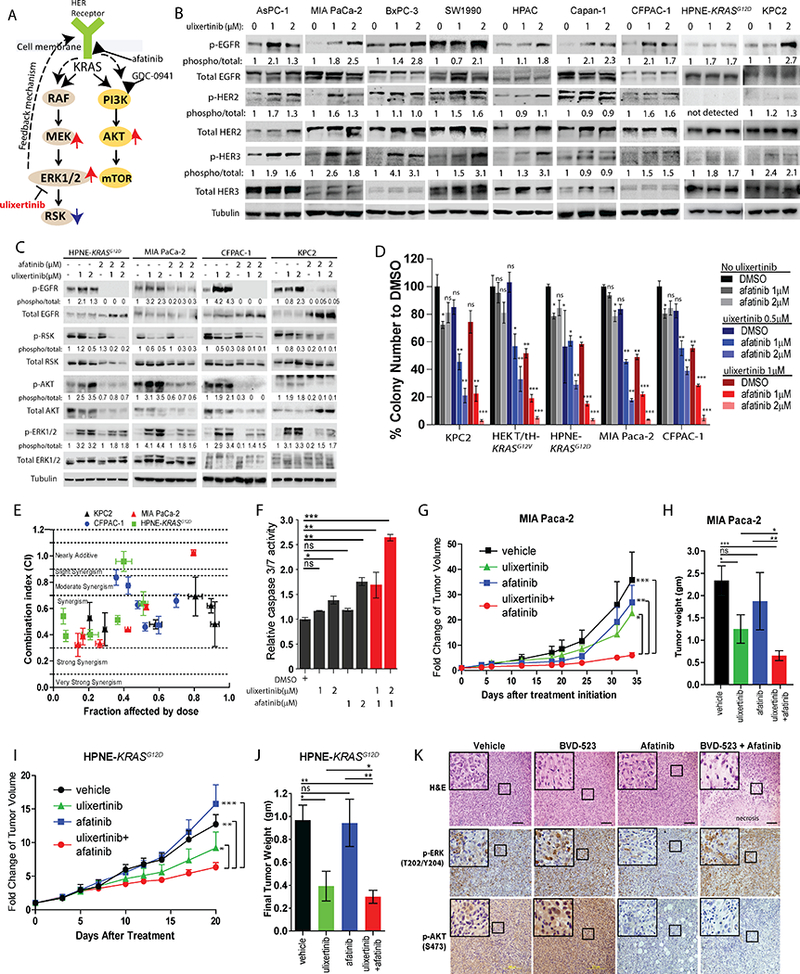
Figure 4. Pan-HER inhibition potentiates the anti-tumor effect of ulixertinib.

A, Hypothesized adaptive mechanisms to ulixertinib and proposed combinatorial strategies with afatinib or GDC-0941. B, Western blots showing changes in phospho-EGFR, phospho-HER2 and phospho-HER3 levels in various PDAC lines after overnight treatment with ulixertinib. C, Western blots showing the overnight treatment effect of ulixertinib, afatinib or both on the indicated proteins across the four PDAC lines. D, Relative quantification of soft agar colonies formed by PDAC lines treated as indicated. One of three sets of experiments, each done in triplicates, was presented. E, Median effect analyses of ulixertinib plus afatinib in four indicated PDAC lines as represented by combination indices at six different fixed-ratio concentrations (all in μM) of ulixertinib: afatinib (10:5, 5:2.5, 2.5:1.25, 1.25:0.625; 0.625:0.31, 0.31:0.15). One of three sets of experiments, each done in triplicates, was presented. F, Caspase 3/7 reporter assay showing the pro-apoptotic effect of ulixertinib and/or afatinib in MIA Paca-2 cells. G, Serial measurements of relative tumor volume (to initial) and H, final weight of MIA Paca-2 tumors grown subcutaneously in nude mice treated as indicated when tumors reached ~100mm3 (N=10/group). I, Serial measurements of relative tumor volume (to initial) and J, final weight of HPNE-KRASG12D tumors grown subcutaneously in nude mice treated as indicated when tumors reached ~100mm3 (N=8/group). K, H&E (upper panels), p-ERK and p-AKT IHC (middle and lower panels) staining showing the effect of drug treatments on MIA Paca-2 tumors. (*p<0.05, **p<0.01, ***p<0.001, scale bars = 100μM).
