
Fig. 3. Measurement of CSC activity based on mammosphere formation.
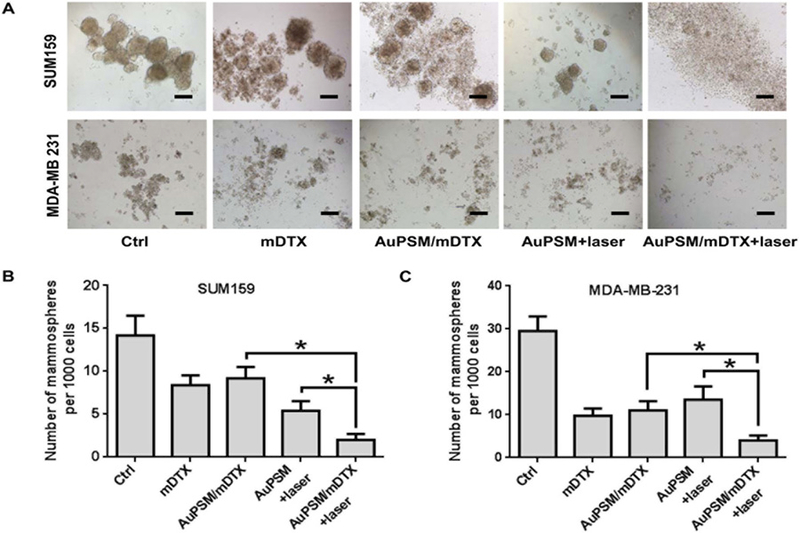
Cells isolated from primary SUM159 and MDA-MB-231 tumors were treated with mDTX and/or mild hyperthermia, and seeded in low attachment plates for mammosphere formation. (A) Representative images of SUM159 and MDA-MB-231 mammospheres 7 days after seeding. Scale bar: 100 µm. (B) Quantitative analysis of SUM159 mammospheres. (C) Quantitative analysis of MDA-MB-231 mammospheres from triplicate experiments. *, p < 0.05.