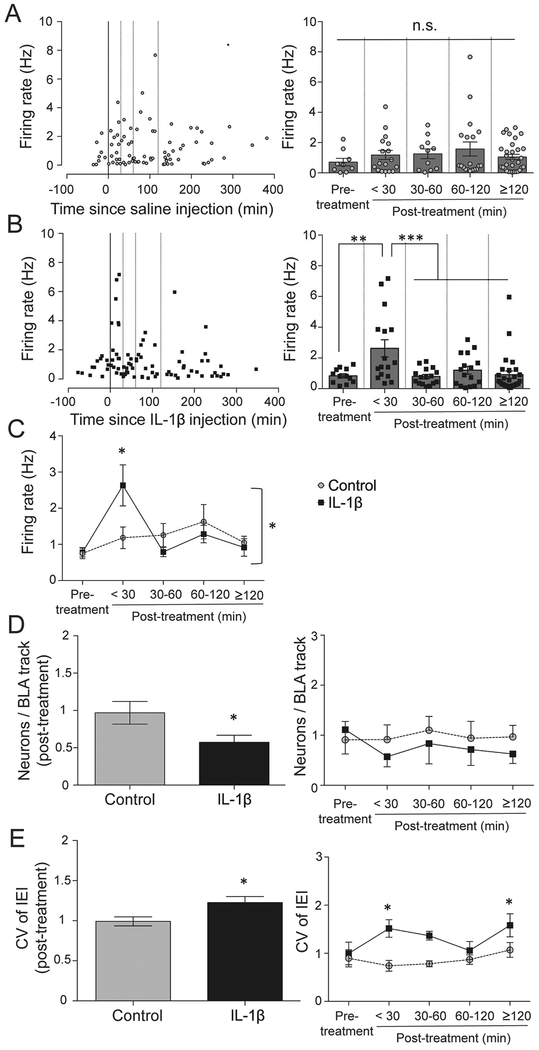
Figure 4: IL-1β treatment acutely increases firing rate in the BLA.
(A) Control group. Firing rate of individual BLA neuron plotted against time from treatment (left). Neurons were grouped into time bins based on the time at which they were recorded. There was no significant effect of control treatment on firing across the time points tested, namely: pre-treatment (baseline), <30 min, 30–60 min, 60–120 min, and ≥120 min post-treatment (right; p>0.05; one-way ANOVA). (B) IL-1β treated group. Firing rate of individual BLA neuron is plotted against time from treatment (left). When analyzed over time, there was a significant effect of IL-1β on firing (right; p=0.001; oneway ANOVA). (C) IL-1β group shows a significant increase in the firing rate at <30 min compared to the control, but returns to the baseline value at later time points. There is a significant interaction between treatment and time [(p=0.016, two-way ANOVA); *p<0.05 by Holm-Sidak’s post hoc test without assuming consistent S.D. after significance in two-way ANOVA]. (D) IL-1β treatment significantly reduced the number of neurons per track in BLA (left; *p<0.05 vs. control, unpaired t-test) and showed a trend towards a reduction in the number of neurons per track over time compared to the control group (right; F(1,193)=1.293, p=0.256, two-way ANOVA). (E) There is a significant post-treatment increase in the CV of IEI of neuronal firing in the IL-1β group compared to the control group (left; *p<0.05, unpaired t-test). Further analysis shows that the CV of IEI is significantly increased at <30 min and ≥120 min (right; *p<0.05 vs. control, Holm-Sidak’s post hoc test after significance in two-way ANOVA). The line through 0 time-point represents time of treatment. Dotted lines represent 30 min, 60 min and 120 min post-treatment. Plots show mean ± S.E.M.

