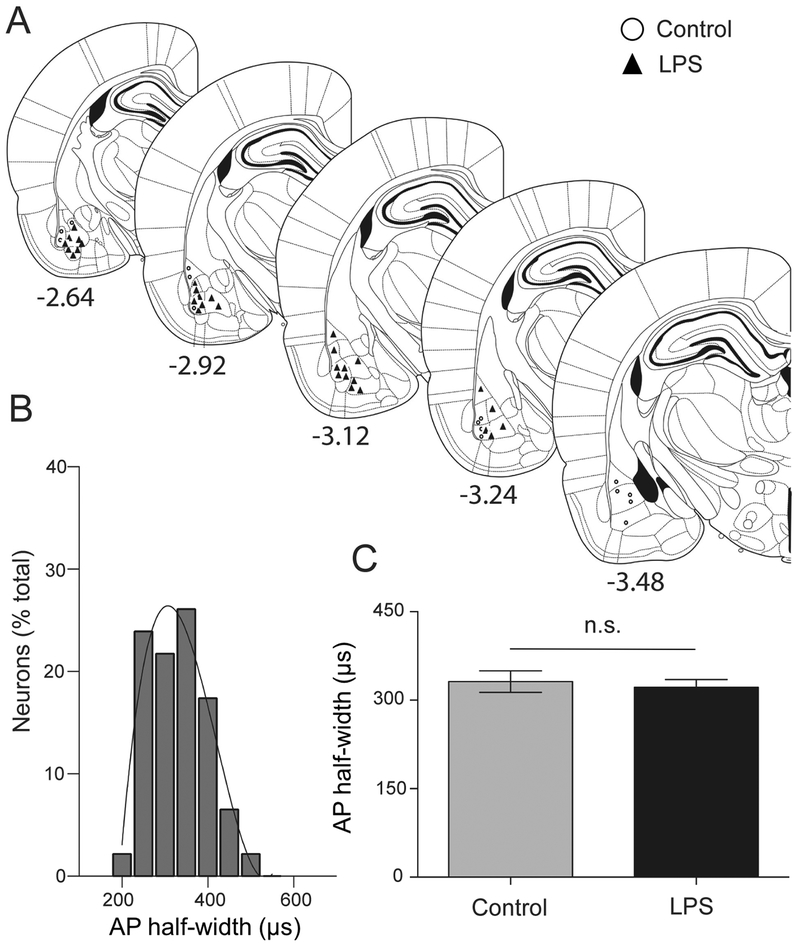
Figure 6: BLA neuronal recording after peripheral LPS treatment.
(A) Recording sites of BLA neurons from LPS and control groups were reconstructed and plotted onto a stereotaxic rat brain atlas (Paxinos and Watson, 2009). Recording sites from control group are marked by open circles and those from LPS-treated group are shown by black triangles. The numbers (mm) indicate bregma level of the sections (B) Frequency distribution of AP half-widths is consistent with a single population of neurons recorded from the BLA (best fit to one curve instead of two). (C) The AP half-width of neurons in the LPS treated group was similar to the control (p=0.669, unpaired t-test). n.s. indicates non-significance. Plot shows mean ± S.E.M.

