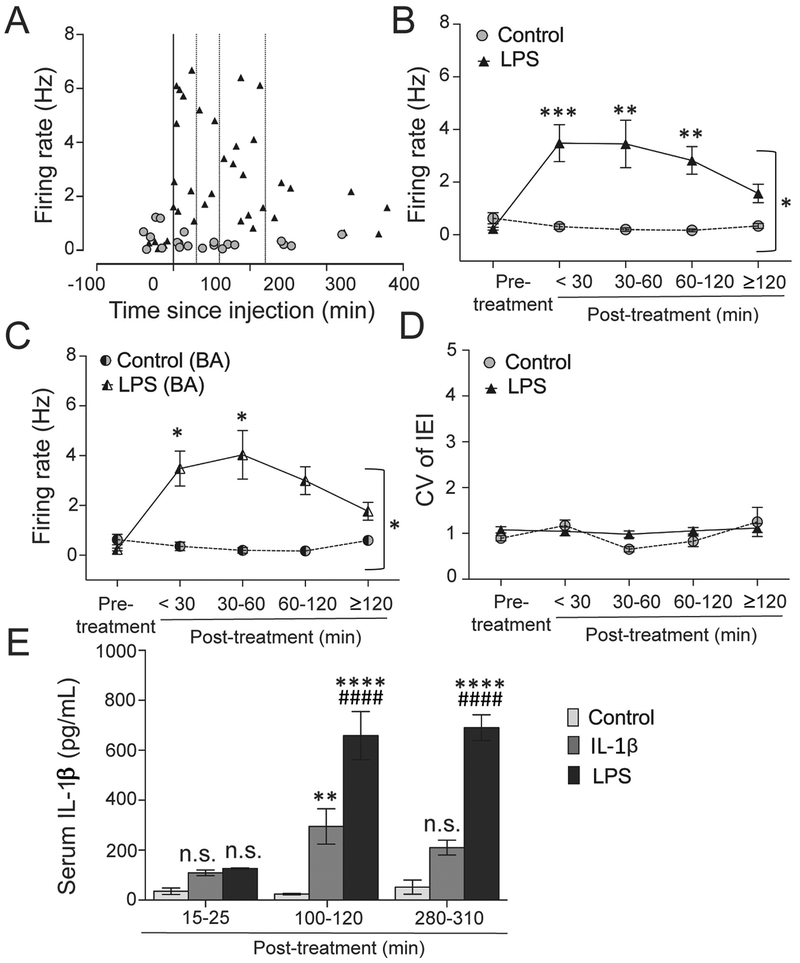
Figure 7: LPS treatment causes prolonged increase in BLA firing rate.
(A) The firing of BLA neurons was measured and plotted against time after saline (control) or LPS treatment. The line through 0 time-point represents time of treatment. Dotted lines represent 30 min, 60 min and 120 min post-treatment. (B) The BLA firing rate between the two groups was compared among five different time-period windows (pre-treatment (baseline), <30 min, 30–60 min, 60–120 min, and ≥120 min post-treatment). There was a significant interaction between treatment over time (p=0.010, two-way ANOVA). The LPS group showed a significant increase in the firing rate at <30 min 30 – 60 min and 60–120 min (i.e. <120 min) after treatment compared to the control. **p<0.01, ***p<0.001 by Holm-Sidak’s post hoc test after significance in twoway ANOVA. (C) Firing rate was significantly increased in the basal (BA) nuclei after LPS treatment at < 30 min. *p<0.05 by Holm-Sidak’s post hoc test after significance in two-way ANOVA. (D) CV of IEI is not changed in the LPS-treated group compared to control (Treatment × time interaction: p=0.224, two-way ANOVA). (E) Pro-inflammatory state induced by IL-1β and LPS treatment in the periphery can be estimated by the eventual infiltration of IL-1β into circulation. Serum levels of IL-1β were assessed by ELISA at different time points (<30 min (15 – 25 min window), 60–120 min (100 – 115 min window) and >240 min (280 – 310 min window)) after single i.p. injection in saline (control group; 250 μL), IL-1β (1 μg in 250 μL) or LPS (250 μg/kg in a volume of 1 mL/kg) treated rats. Serum IL-1β levels were unchanged at <30 min (15 – 25 min window) post-treatment in all the three groups, but was significantly increased in the IL-1β and LPS treated groups at the 60–120 min post-treatment time-point compared to the control. At 60–120 min time-point (100 – 120 min window), level of IL-1β in the serum was also significantly higher in the LPS-treated rats compared to the IL-1β treated group. After 240 min (280 – 310 min window) of treatment, serum IL-1β remained elevated only in the LPS-treated group compared to the other two groups. **p<0.01, ****p<0.0001 vs. control; ####p<0.0001 vs. IL-1β group at respective time points; n.s. indicates non-significance vs. control at that time-point; Holm-Sidak’s post hoc test after significance in two-way ANOVA. Serum samples from N = 5 rats (control), 7 rats (IL-1β) and 4 rats (LPS) / group at each time point were tested from a total of 48 rats in duplicate or triplicate. Plots show mean ± S.E.M.

