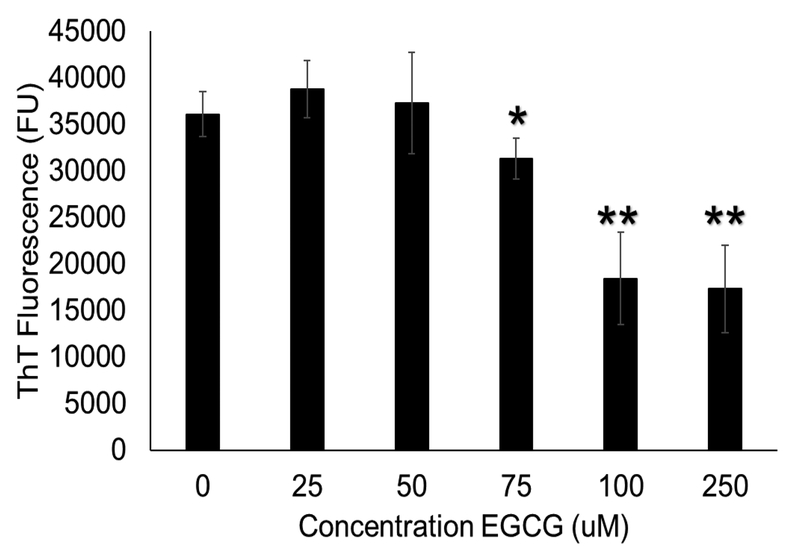
Figure 7.
EGCG dose response for hydroxyapatite binding assay with S. mutans in media alone (no saliva), there was a dose dependent decrease in ThT fluorescence with addition of EGCG, a 53% decrease in ThT fluorescence was seen with 250 μM EGCG, comparable to the decrease seen in the plate assay. (* = p < 0.05, ** = p < 0.01, compared to 0 μM EGCG)

