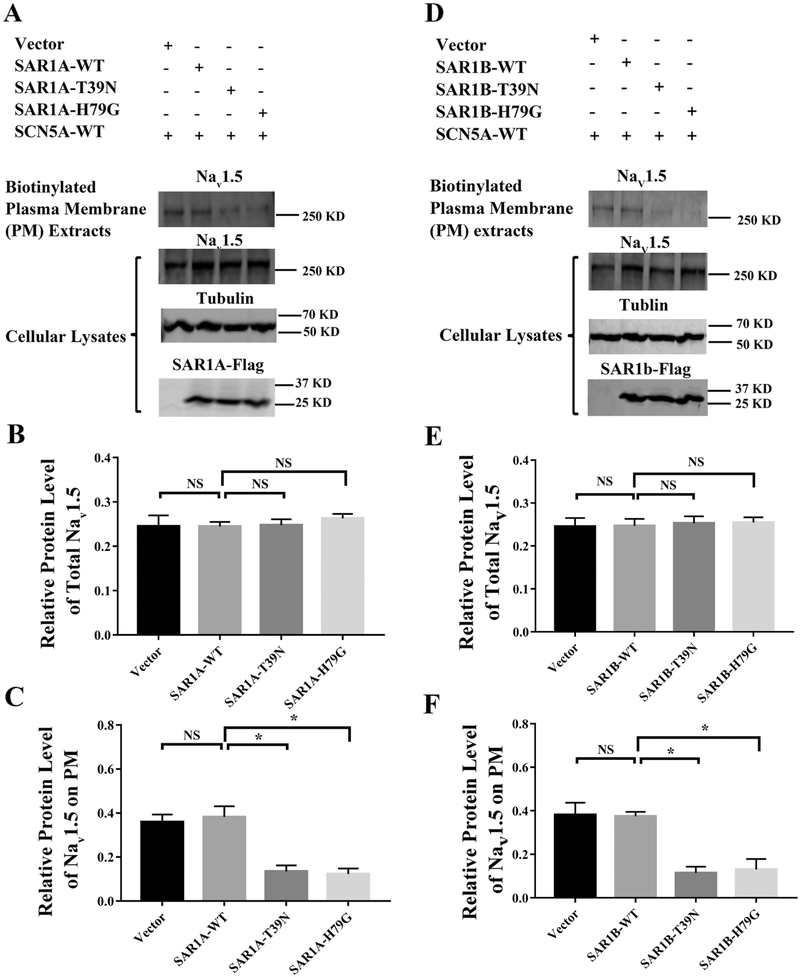
Fig. 1.
Mutant SAR1A and SAR1B GTPases with dominant negative mutations T39N and H79G decrease the cell surface expression of Nav1.5. (A) Western blot analysis of Nav1.5 using plasma membrane protein extracts or total cellular lysates from HEK293 cells transfected with expression plasmids for wild type (WT) SAR1A-Flag, SAR1A:T39N-Flag, and SAR1A:H79G-Flag, or the empty vector control. The plasma membrane protein extracts were prepared using the biotinylation procedure. (B) Quantified data from Western blot analysis as in (A) showing the relative amount of Nav1.5 over tubulin in total cell lysates. (C) Quantified data from Western blot analysis as in (A) showing the relative amount of Nav1.5 over tubulin in plasma membranes over Nav1.5 over tubulin in total cell lysates. (D) Western blot analysis of Nav1.5 using plasma membrane proteins extracts or total cellular lysates from HEK293 cells transfected with expression plasmids for wild type SAR1B-Flag, SAR1B:T39N-Flag, and SAR1B:H79G-Flag, or the empty vector control. The plasma membrane proteins extracts were prepared using the biotinylation procedure. (E) Quantified data from Western blot analysis as in (D) showing the relative amount of Nav1.5 over tubulin in total cell lysates. (F) Quantified data from Western blot analysis as in (D) showing the relative amount of Nav1.5 in plasma membranes over Nav1.5 in total cell lysates. All studies were repeated at least three times. Data are shown as mean ± SEM. NS, not significant; *P < 0.05 (n=3).

