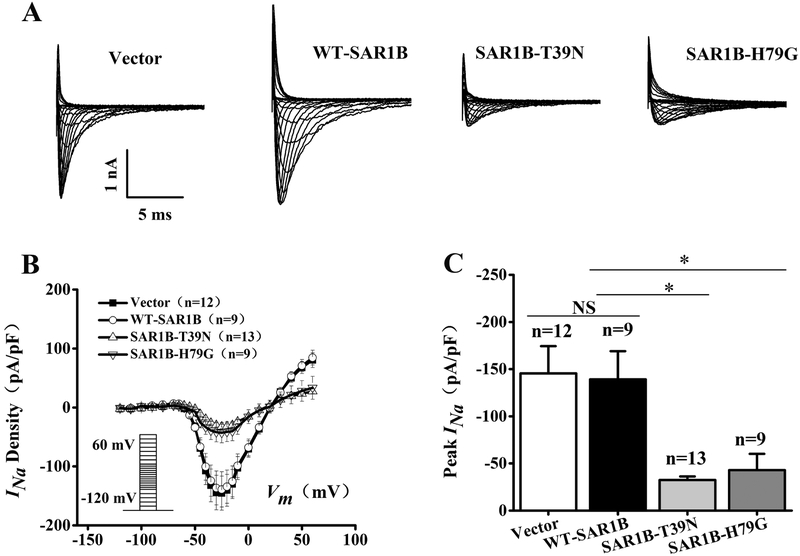
Fig. 3.
Mutant SAR1B GTPases with dominant negative mutations T39N and H79G decrease densities of sodium current INa in HEK/Nav1.5 cells. (A) Representative whole-cell sodium current traces recorded from HEK/Nav1.5 cells transfected with the empty vector control or expression plasmids for wild type SAR1B-Flag, SAR1B:T39N-Flag or SAR1B:H79G-Flag. (B) The relationship between the average current density (current normalized to cell capacitance) and voltage. The voltage clamp protocol was shown in the inset. (C) The relative peak sodium current density at −25 mV among different treatment groups. Current densities (pA/pF) were −145.57±28.87 (n=12 cells) for empty vector control, −32.55±3.76 (n=13 cells) for SAR1B:T39N-FLAG, −42.97±17.19 (n=9 cells) for SAR1B:H79G-FLAG, and - 139.08±29.98 (n=9 cells) for WT-SAR1B-FLAG. Data are shown as mean ± SEM. NS, not significant; *P < 0.05.

