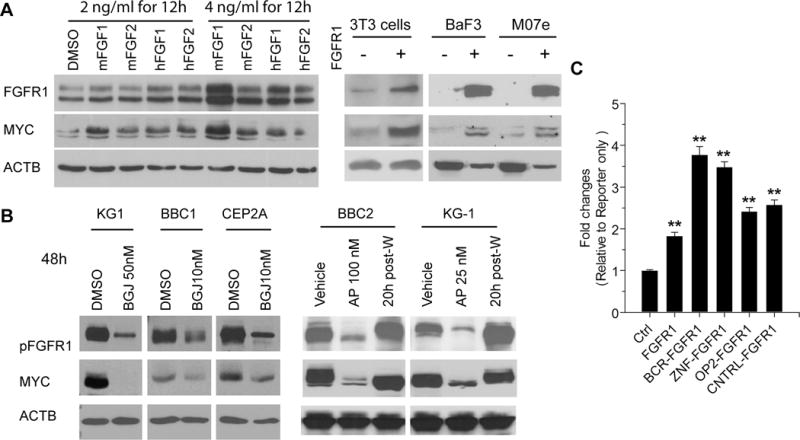
Figure 3. MYC expression correlates with FGFR1 and chimeric FGFR1 expression levels.

A520 cells, which overexpress FGFR1, were treated with mouse and human FGF1 and FGF2, at two concentrations for 12 hours. In each case, upregulation of FGFR1 is seen, which correlated with increased MYC expression (A, left). Forced expression of wild type FGFR1 in mouse 3T3 or BaF3 cells or human M07e cells leads to increased MYC levels (A, right). Treatment of human (KG1) and mouse (BBC1 and CEP2A) leukemia cells with the BGJ398 FGFR kinase inhibitor for 48 hours at the IC50 dose leads to downregulation of MYC (B, left). Treatment of BBC2 and KG1 cells with the ponatinib (AP) FGFR1 inhibitor shows similar down regulation of activated FGFR1 and MYC (B, right). When this drug was washed out (post-W) and the cells re-assayed 20 hours later, FGFR1 and MYC levels recover proportionately. Luciferase assays (C) using a MYC promoter construct shows that co-transfection with wild type FGFR1 leads to increased luciferase activity which are further increased in cells co-transfected with four different FGFR1 chimeric kinases compared with cells co-transfected with the pcDNA3.1 control (Ctrl). ** = p < 0.001.
