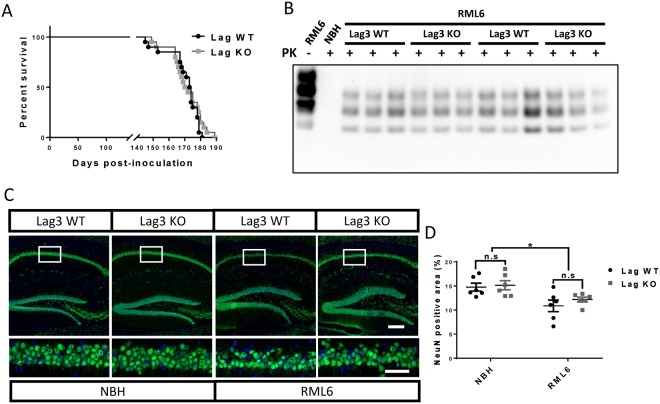
Figure 2.
Incubation times, PrPSc levels and neurodegeneration in Lag3 WT and KO mice after prion infection. (A) Survival curves of Lag3 WT and KO mice after prion infection. Median incubation time: 173.5 days for Lag3 WT mice and 171 days for Lag3 KO mice. Twenty mice containing both genders were pooled together for both of the Lag3 WT and KO mice. Log-rank (Mantel-Cox) test was used for the comparison of survival curves. (B) Representative image of a western blot examining PK-resistant PrPSc levels in the brains of Lag3 WT and KO mice. Full-length blots are presented in Supplementary Fig. 4. (C) Representative images of NeuN staining in the hippocampus of the Lag3 WT and Lag3 KO mice. Scale bars: 100 μm for the upper images and 50 μm for the lower images. (D) Quantitative data of the NeuN positive areas shown in (C). *P < 0.05 (n = 6). n.s, not significant. NBH, Normal Brain Homogenate; RML6, Rocky Mountain Laboratory, Passage 6.

