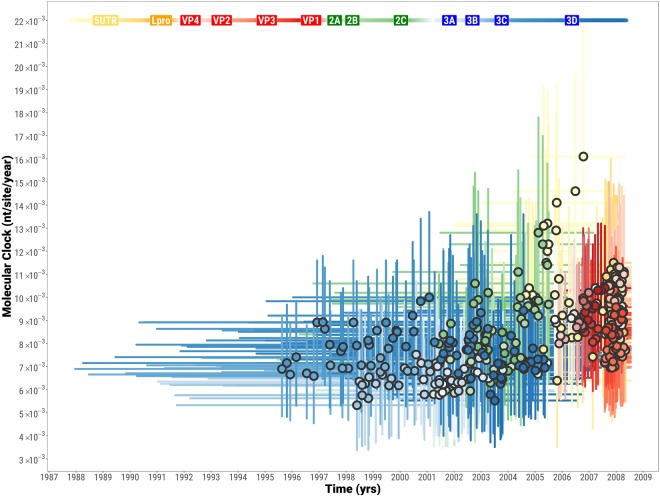
Figure 6.
Evolutionary dynamics of each of the O/ME-SA/Ind-2001d and O/ME-SA/Ind-2001e genome fragments. The circles represent the MCRA of each tree as depicted in Fig. 5 with their associated molecular clock. MRCAs and molecular clocks were estimated over the full genomes from 386 genome fragments of 400 nt length at 20 nt steps. 95% BCIs for both the MRCAs and molecular clocks are indicated by line ranges drawn at the x and y axes, respectively.

