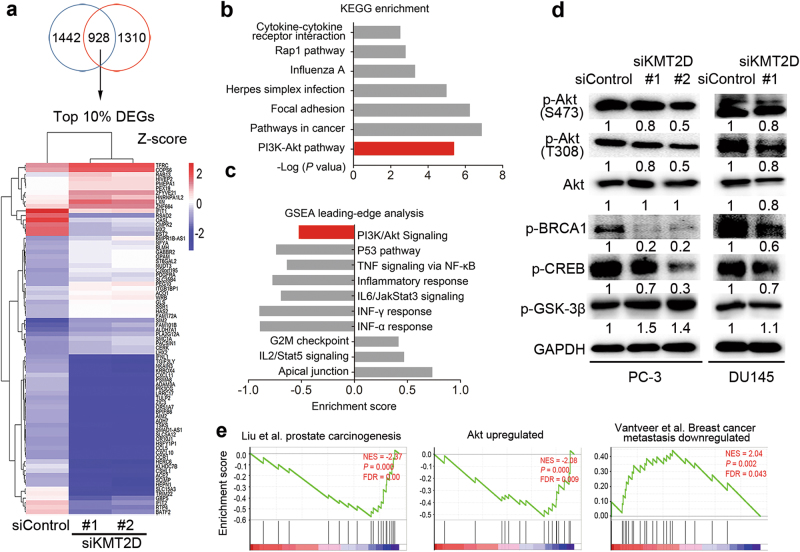
Fig. 5.
RNAseq identifies transcriptional changes enriched in PI3K signaling following loss of KMT2D. a A Venn diagram depicting the overlapping DEGs in PC-3 cells transduced with two siRNAs against KMT2D vs. siControl-treated PC-3 cells (top) and heatmaps showing the top 10% of overlapping DEGs (bottom). b, c Pathway enrichment identified by KEGG b and GSEA c analysis of the DEGs between KMT2D-depleted PC-3 and siControl cells. d Western blot analysis of Akt and phospho-Akt (S473 and T308), p-BRCA1, p-CREB, and p-GSK3β after KMT2D knockdown in PC-3 and DU145 cells. e GSEA analysis of the DEGs enriched in prostate carcinogenesis, Akt upregulated, and breast cancer metastasis downregulated pathway

