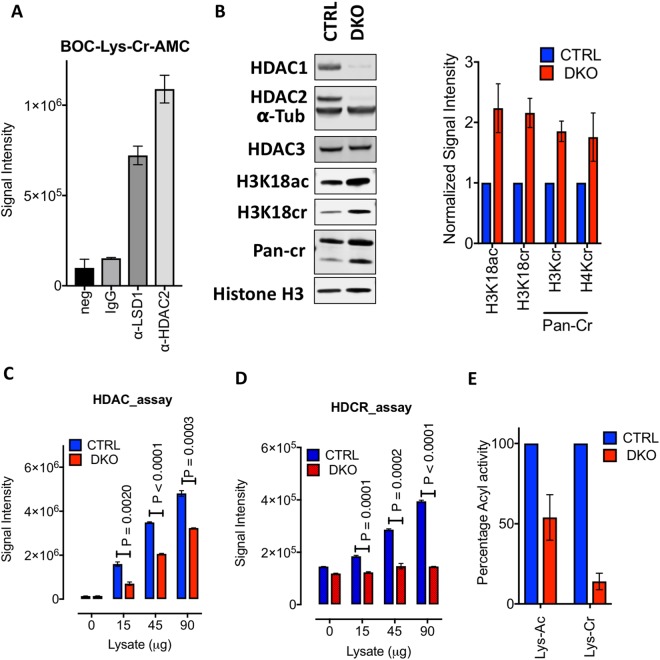
Figure 3.
HDAC1/2 are the dominant histone decrotonylases in ES cells. (A) The decrotonylase activity of HDAC1/2 complexes isolated from ES cells, using antisera to HDAC2 and LSD1, were measured using a Boc-Lys(Cr)-AMC substrate. No cell lysate (neg) and normal mouse IgG were used as negative controls. Average (±SD) plots of n = 3 technical replicates. (B) Quantitative western blot data for the indicated proteins in Ctrl (day 0) and DKO ES cells treated with 4-hydroxytamoxifen (OHT) at day 3, were performed using an Odyssey scanner. Graphs show the average normalized signal intensity (mean ± SEM; n ≥ 3) relative to Histone H3. Uncropped scans of western blots are shown in Supplementary Fig. 3A–C. (C) Deacetylase and (D) decrotonylase assays were performed using whole-cell extracts from Ctrl (day 0) and DKO ES cells (day 3, following OHT treatment). Average (±SD) plots of n = 3 technical replicates. (E) Changes in both deacetylase and decrotonylase activity in DKO ESCs were calculated as a percentage of CTRL ES cells from the values depicted in (C) and (D).

