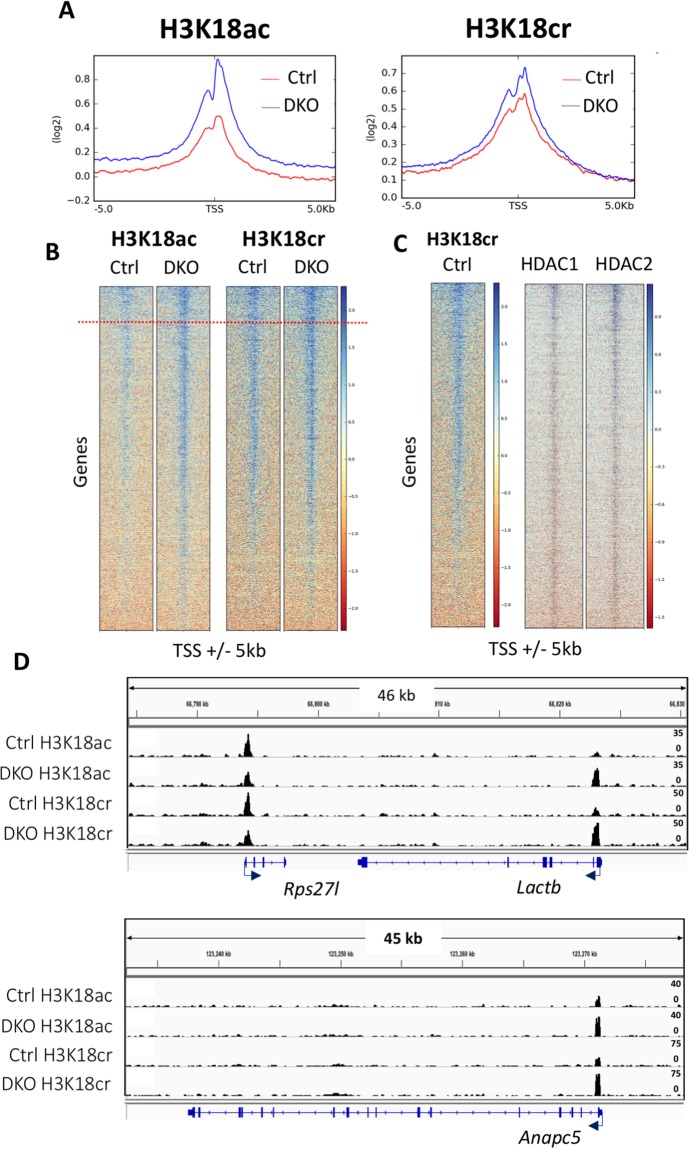
Figure 4.
Loss of HDAC1/2 leads to a global increase in H3K18cr and H3K18ac. (A) Average ChIP coverage levels of H3K18ac and H3K18cr in Ctrl and DKO ES cells at transcriptional start sites (TSS) 5,000 bp upstream and downstream. (B) ChIP-seq density heatmaps in Ctrl and DKO ES cells for H3K18ac and H3K18cr at TSS ±5,000 bp, ranked by increase in acetylation or crotonylation following Hdac1/2 deletion. Red dotted line indicates the top 10% of genes enriched for H3K18ac and H3K18cr. (C) Heatmap of HDAC1 and 2 densities [as defined in Whyte et al.38] at TSS sites ±5,000 bp ranked by H3K18cr levels in Ctrl cells. (D) IGV enrichment tracks of H3K18ac and H3K18cr at the three representative genes: Rps27l, Lactb and Anapc5. The gene structure and dimensions are indicated in each panel.

