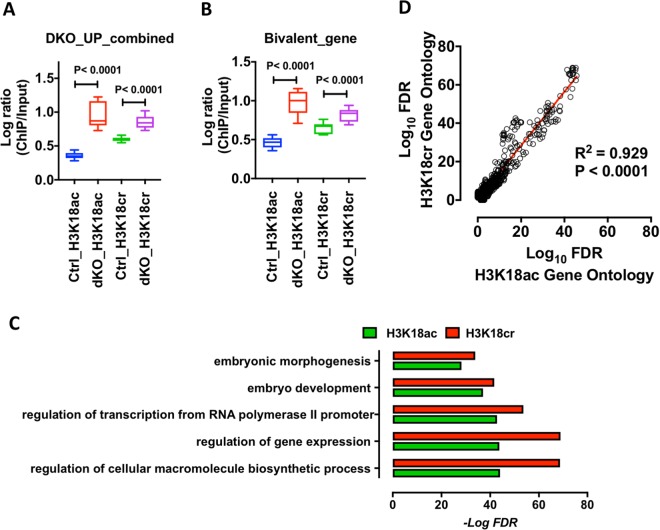
Figure 5.
Loss of HDAC1/2 regulates H3K18cr levels associated with active gene expression. Average levels of H3K18ac and H3K18cr in Ctrl and DKO ES cells: (A) at upregulated genes following the loss of HDAC1/2 [as defined in Jamaladdin et al.29]; and (B) genes associated with bivalent histone signatures [as defined in Mikkelsen et al.36]. Acetylation level was calculated using DEEPTOOLS for each promoter, defined as the region between ±500 bp of the TSS, and presented in log2 scale. (C) Functional annotation analysis of the top 10% of genes enriched for either H3K18cr or H3K18ac (Fig. 4B; red line). DAVID was used to identify biological process (BP) and gene ontology (GO). (D) Regression analysis of false discovery rate (FDR) from enriched GO terms for both H3K18ac and H3K18cr. Data presented in log10 scale.

