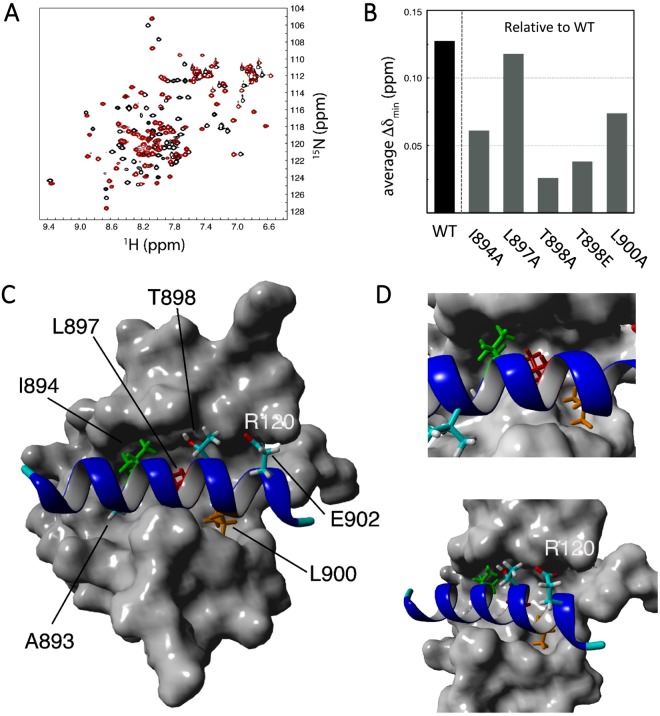
Figure 4.
NMR and structural modelling of the PAH1:Tet1 complex. (A) Overlay of the 15N-HSQC spectra of apo-PAH1 (black) and wild-type PAH1:Tet1 complex (red). All NMR data was recorded at 303 K. (B) Results of minimal chemical shift mapping of various PAH1-Tet1 complexes. Value for the WT complex (coloured black) is computed relative to the apo state and establishes the magnitude of the effect. Values for mutant complexes are computed relative to the WT-complex and thus are a measure for the importance of the mutated residue for complex formation. (C) Model of the PAH1:Tet1 complex derived from the PAH1:Sap25-SID NMR ensemble (see methods). PAH1 is shown in surface representation; the Tet1 peptide in ribbon presentation with crucial residues as sticks: A893, I894 (green), L897 (red), T898, L900 (orange), and E902. The latter is potentially capable of an electrostatic interaction with PAH1-R120. (D) Close-ups of the PAH1:Tet1 complex; crucial residues shown and highlighted as in (C).

