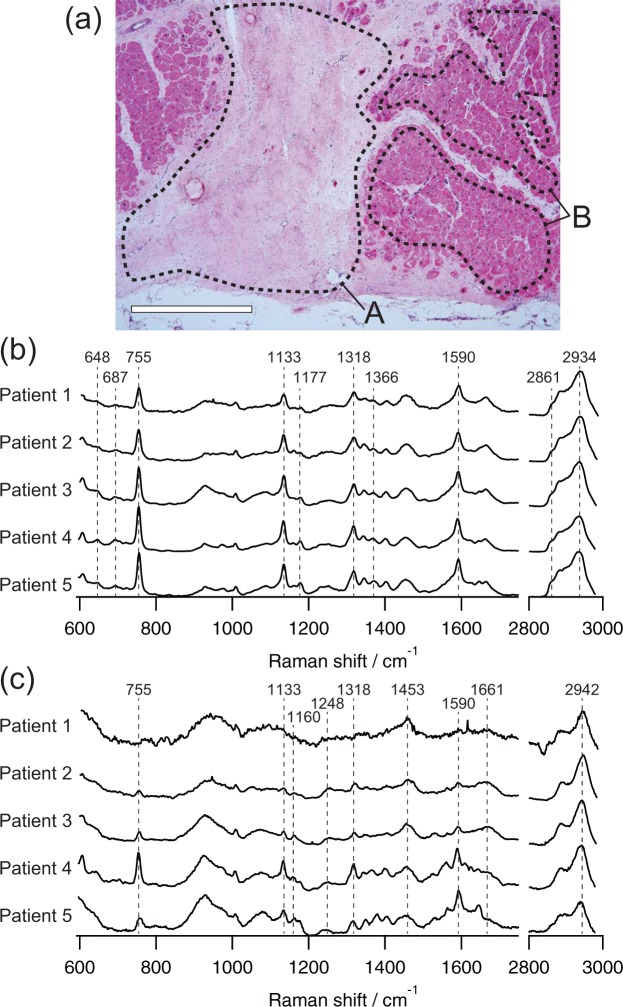
Figure 1.
Raman spectra of the border zone myocardium obtained from 5 patients. (a) A representative HE-stained image of the boundary between the infarcted region (dashed area A) and non-infarcted region (dashed area B) of the heart tissue excised from patient 3. Scale bar represents 1 mm. Representative Raman spectra of non-infarcted myocardium (b) and infarcted myocardium (c) of each patient. Each spectrum was averaged to obtain sufficient signal-to-noise ratio for the detail identification of Raman bands, and normalized by the integrated intensity of each Raman spectrum.

