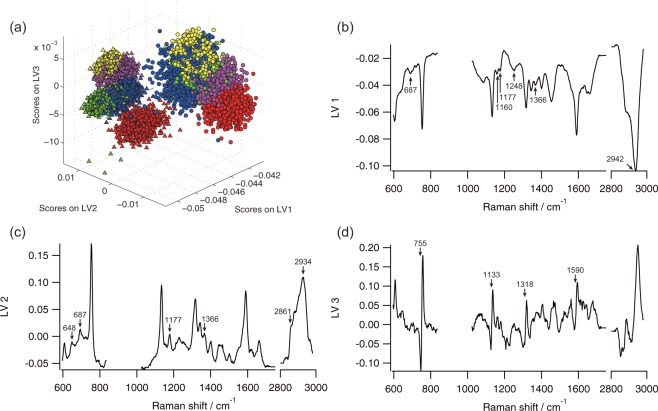
Figure 4.
PLS-DA of non-infarcted and infarcted myocardium. (a) Score plot of LV1, LV2, and LV3. Triangle, non-infarcted cardiac tissue; circle, infarcted cardiac tissue; red, patient 1; green, patient 2; blue, patient 3; yellow, patient 4; and purple, patient 5. Contributions of LV1 (b), LV2 (c), and LV3 (d) to Raman spectra are 78.65%, 2.56%, and 0.41%, respectively.

