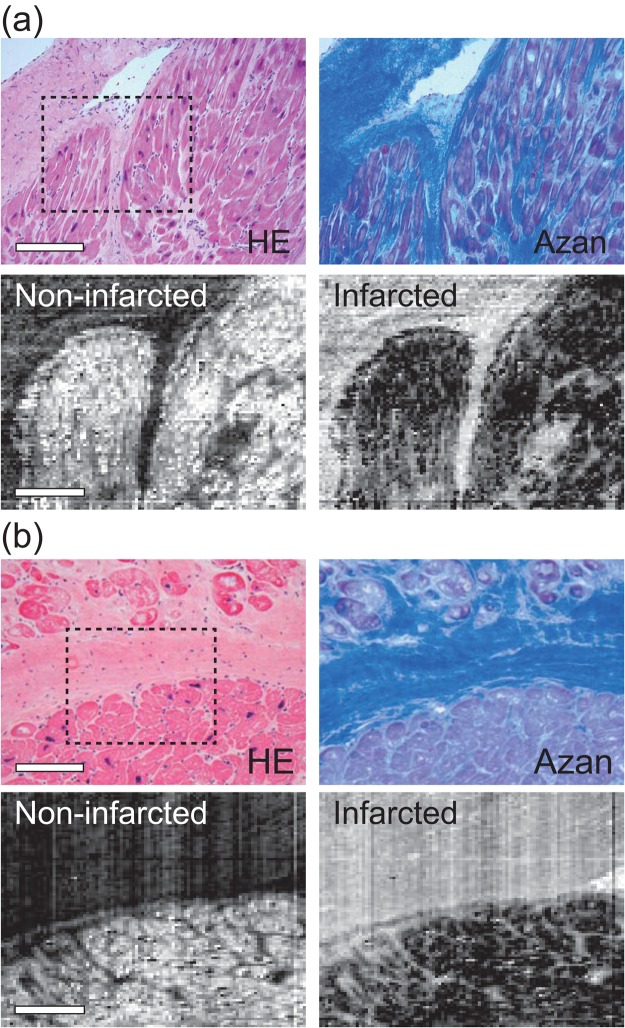
Figure 5.
Representative 2D Raman images of a marginal region of non-infarcted and infarcted myocardium. (a,b) Two representative marginal regions of non-infarcted and infarcted myocardium of patient 3. Raman images at the dashed squares indicated in the HE-stained images were reconstructed by using PLS-DA-based prediction of tissue species. Scale bars in the HE-stained and Raman images in (a) and (b) are 200 µm and 100 µm, respectively.

