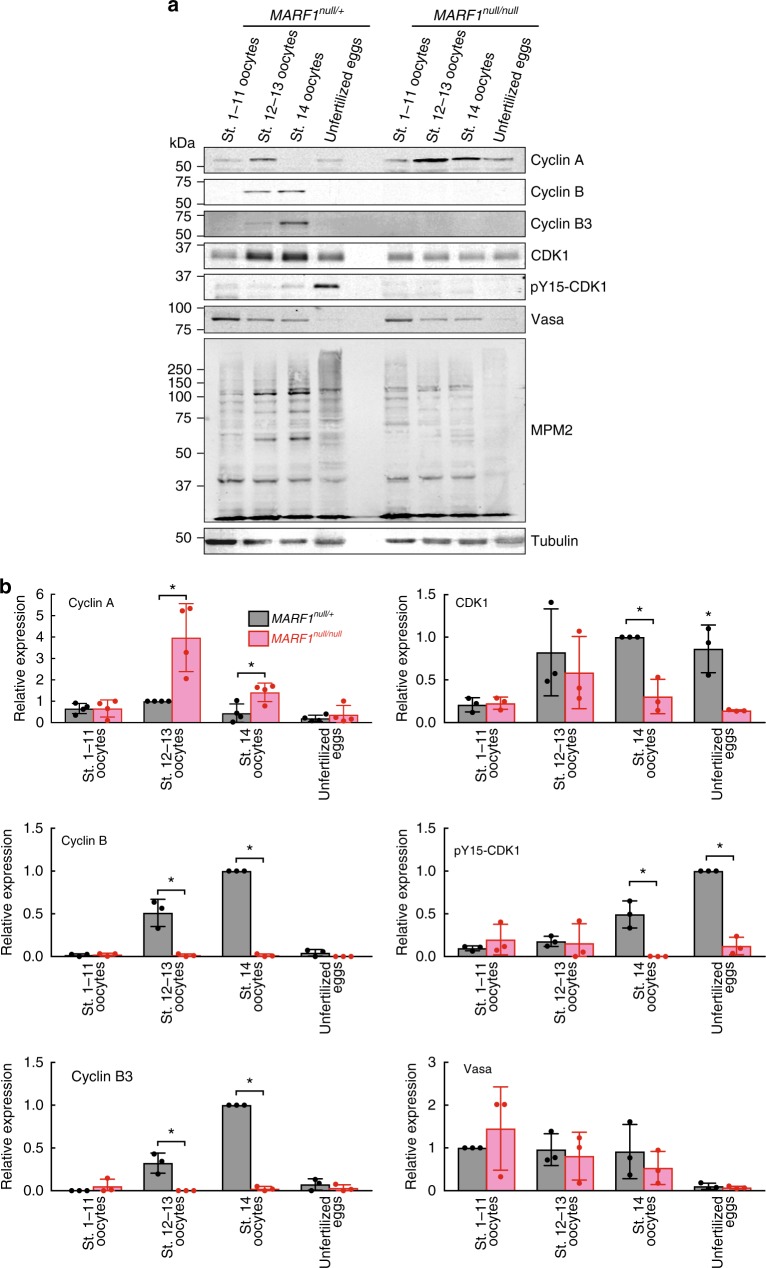
Fig. 5.
Dysregulation of meiotic cyclin protein levels and phosphoprotein profile in MARF1null stage 14 oocytes. a Western blots using dissected oocytes and unfertilized eggs. b Western blot quantification, whose representative images are shown in a. Protein levels were normalized to that in control (MARF1null/+) oocyte stage showing the highest expression (Stages 1–11 for Vasa. Stages 12–13 for Cyclin A. Stage 14 for Cyclin B, Cyclin B3, and CDK1. Unfertilized eggs for pY15-CDK1). Mean ± SD (n = 4 for CycA and n = 3 for all the others). P-value < 0.05 (Student’s t-test) are indicated by *

