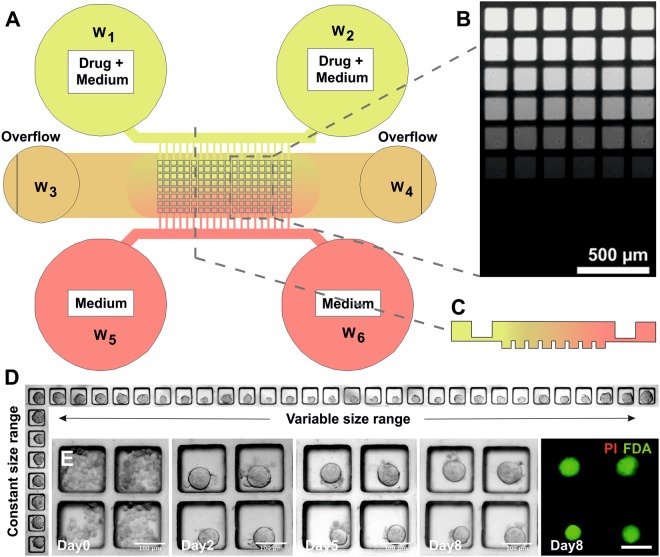
Figure 1.
Microfluidic device layout and functions. (A) Schematic representation of the device structure, comprising a microchannel network and an array of square micro-wells, with a width of 150 µm and a depth of 180 µm. By seeding a single cell aggregate into the central channel, compact spheroids were formed over 48 hours. The microfluidic network enabled both to perfuse fresh medium, and to create a compound concentration gradient across the array. (B) Fluorescent image showing a calcein concentration gradient over the micro-well array. (C) Schematic cross-section of the gradient generated along a column of the spheroid array. (D) Representative images of spheroid size distribution obtained along rows and columns of the micro-well array. (E) Example of prostate tumour biopsy-derived spheroids formed from a single cell suspension and subsequent culture in the micro-wells (vehicle control; brightfield images from day 0 to day 8; fluorescent image from viability stain on day8 using FDA (green) and PI (red)). Scale bars = 100 µm.

