Figure 3.
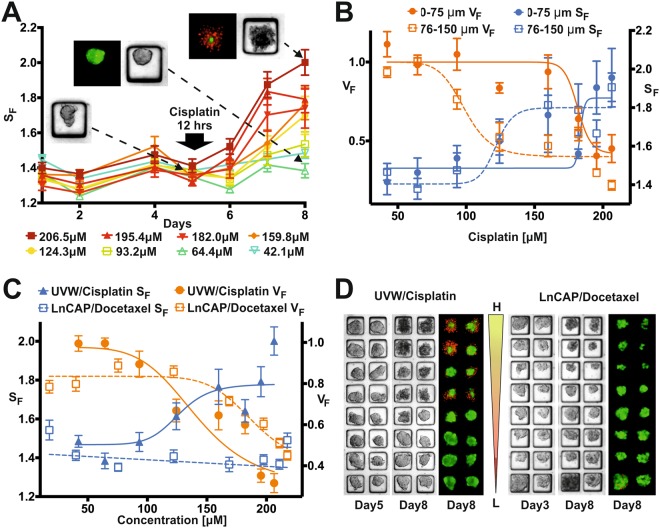
Screening readouts. (A) Temporal evolution of the average shape factor, SF, in each row of the spheroid array when using UVW cells. Each row was exposed to a decreasing concentration of cisplatin for 12 hours (as estimated from the numerical simulation), from 206.5 µM (Row 1) to 42.2 µM (Row 8). Inserts show brightfield and fluorescent images of representative spheroids prior to drug application (day 5) and after viability staining (day 8, red = PI, green = FDA) for different positions in the array. (B) 8-point concentration response curves obtained from data analysis averaging outcomes from each row of the spheroid array using UVW and cisplatin (n = 24). Both viable fraction, VF, and shape factor, SF, are plotted for the two spheroid size groups analysed: Group 1 = 0–75 µm and Group 2 = 76–150 µm. EC50 VF Group 1 = 181.5 µM, EC50 VF Group2 = 98.9 µM, EC50 SF Group1 = 183.5 µM, EC50 SF Group2 = 121.8 µM. (C) Comparison between 8-point concentration response curves obtained by exposing UVW spheroids to cisplatin and LNCaP spheroids to docetaxel in gradient devices for 12 hours. Both viable fraction, VF, and shape factor, SF, curves are plotted for all the spheroids in the array. Values are shown as mean (of n = 24 spheroids) ± standard error of the mean. (D) Representative brightfield and fluorescent images obtained from UVW-cisplatin (day 5 and 8) and LNCaP-docetaxel experiments in gradient devices (day 3 and 8), confirming successful gradient formation and consequent drug effects.

