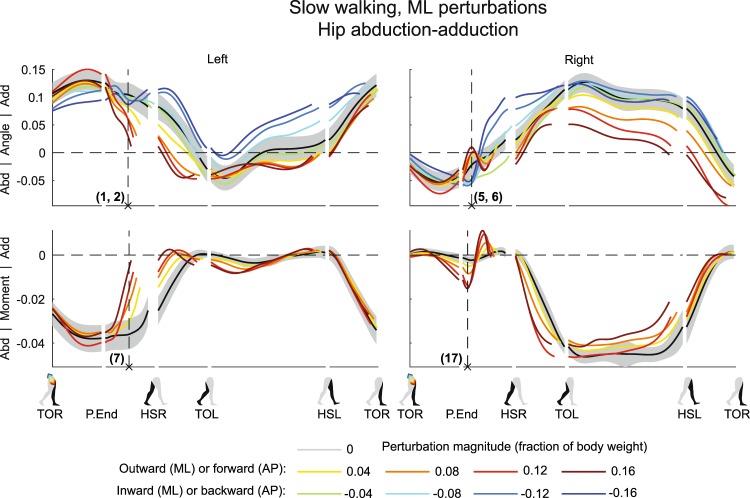
Figure 1.
Subject-average angles, moments, and power for left and right hip ab/adduction after ML perturbations. Data is split into sequences, and shown for one gait cycle after perturbation onset at TOR (toe-off right). Subsequent events are P.End (perturbation end), HSR (heel-strike right), TOL (toe-off left), HSL (heel-strike left), and again TOR. The horizontal length of each line in a sequence reflects the duration of that sequence relative to the other conditions. Angles are in radians. Moment and power are dimensionless, with subject average scaling factors of 1215 ± 259 Nm and 2739 ± 562 W, respectively. Colors indicate the perturbation magnitudes. Yellow-red corresponds with outward perturbations, green-blue with inward perturbations. The gray shading is the subject-average standard deviation, only shown for the unperturbed condition to prevent image cluttering. In case of inward perturbations, joint moments and power are left out due to cross-stepping with both feet on the same force plate. Abd: abduction. Add: adduction.

