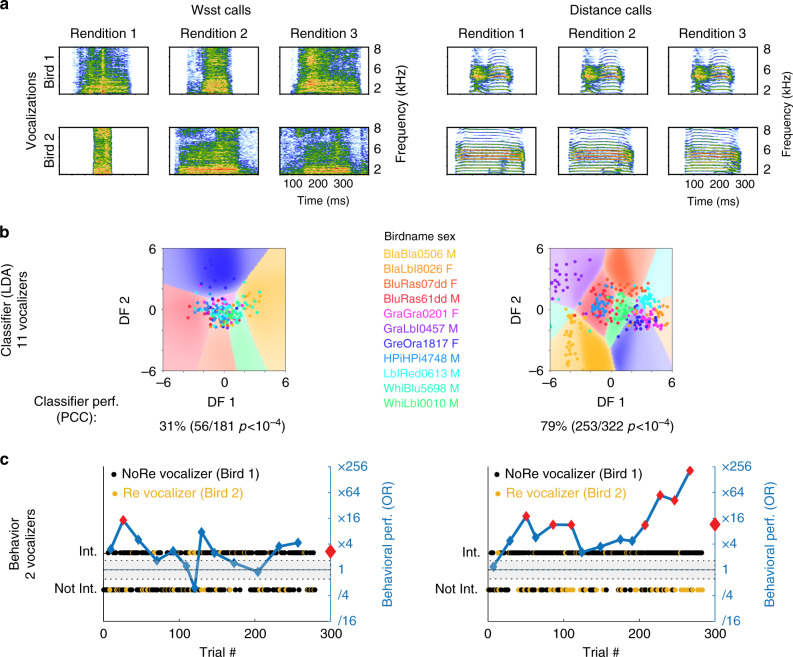
Fig. 3.
Vocalizer discrimination for two call types. Vocalizations (a): Spectrograms of aggressive calls (Ws, Supplementary Audio 1) and contact Distance calls (DC, Supplementary Audio 2) from two different males. Regularized linear discriminant analysis (LDA, b): LDA was performed on acoustic features to classify calls (each dot corresponds to a call rendition) along the same 11 vocalizers for Ws (n = 181) and DC (n = 322). Cross-validated classifier performance is shown as Percent of Correct Classification (PCC; chance level, 9.1%). Behavior (c): The behavioral performance of one subject for discriminating Bird1 vs. Bird2 is shown for Ws (35 and 31 renditions) and DC (29 and 33 renditions). Each dot corresponds to a stimulus (i.e. a sequence of calls). The behavioral performance as measured by the odds ratio (OR, see Fig. 1) is given by the blue line. Red diamonds indicate an OR value significantly different from 1. The gray area depicts the 5−95% quantiles for a random odds ratio for all trials

