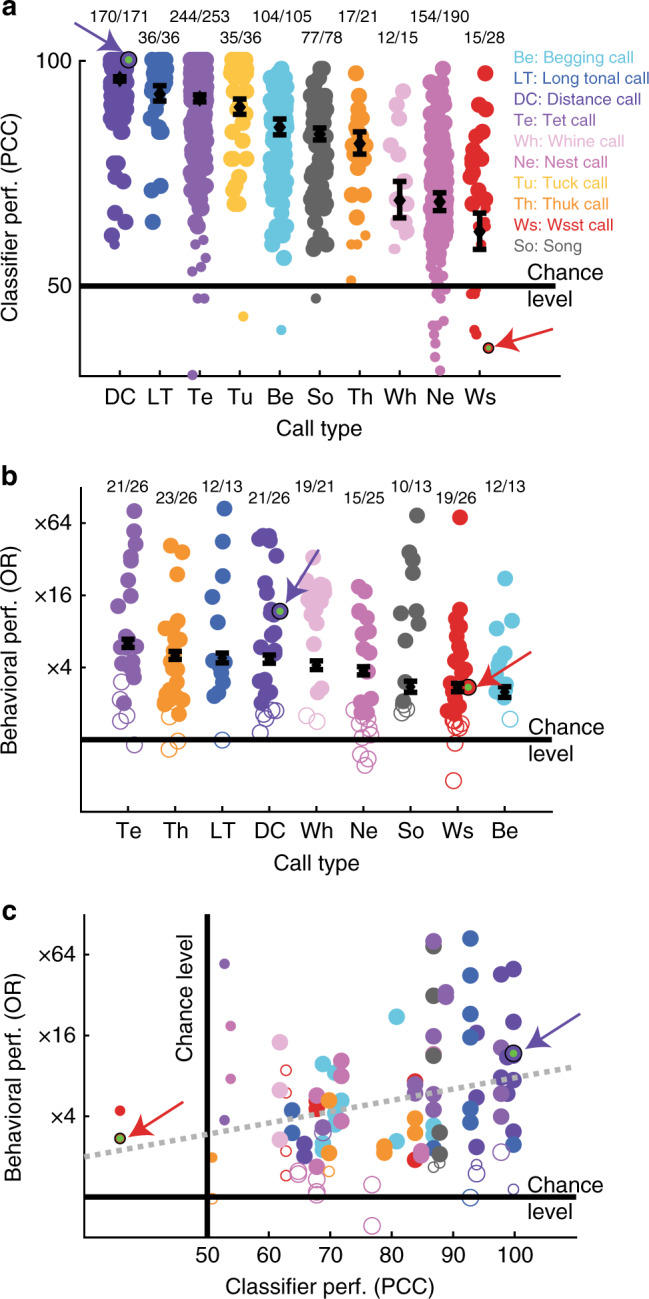
Fig. 4.

Vocalizer discrimination within each call type. a Each circle corresponds to the performance of the regularized LDA at discriminating a pair of vocalizers (large circles: acoustic discrimination of pairs of vocalizers significantly above chance tested by binomial test at p < 0.05 on PCC; effect of call type: likelihood ratio test (LRT) on Generalized Linear Mixed Effects models (GLME), χ29 = 4406.5, p = 2.2×10⁻¹⁶); b Each circle corresponds to the behavioral performance of bird subjects at discriminating pairs of vocalizers in a single-call-type test (n = 13). The behavioral performance is measured as the odds ratio, OR (filled circles: OR significantly above chance tested by exact test as described in Methods; effect of vocalizer: LRT on GLME, χ21 = 2814.2, p = 0; effect of call type: LRT on GLME, χ28 = 700.7, p = 0; see Supplementary Table 1 for all statistical results); c Correlation between the behavioral and the classifier performance for discriminating pairs of vocalizers (regression line indicated by the gray dotted line: ρ = 0.2381, p = 0.0058, two-tail Spearman coefficient, n = 79). The performances of the subject shown in Fig. 3 and of the classifier on the same stimuli are identified by arrows and small green dots in all three panels. Black diamonds and error bars in a and b: estimates of the GLME coefficients and their 95% confidence intervals. In all three panels, call type is color coded as described in a
