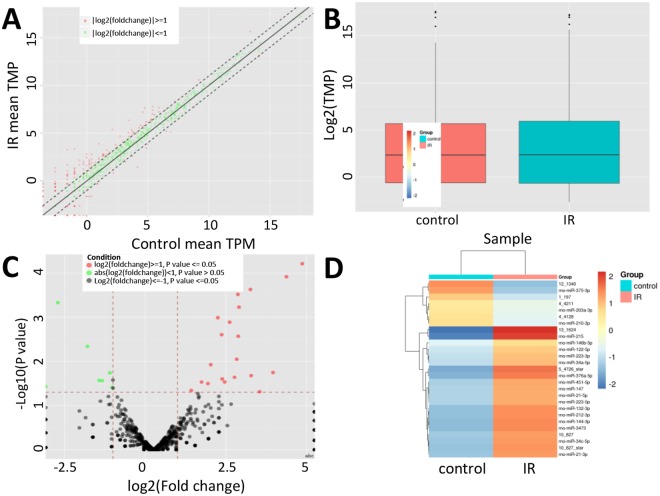
Figure 2.
Identification of differentially expressed miRNAs. (A) Scatter plots assess the miRNA expression variation between the two compared groups. The miRNAs above the dotted line and below the bottom dotted line indicated more than two-fold changes between the two compared samples. (B) Box plot of log2 (FPKM) values across control and IR miRNAs. Control, normal esophageal tissue sample and IR, ionizing radiation treated sample. (C) Volcano plot of the differentially expressed miRNAs. The vertical lines correspond to 1.5-fold up and down, respectively, and the horizontal line represents P = 0.05. The green and red dots in the plot represent the differentially expressed miRNAs with statistical significance. (D) Heat map showing expression profiles of differentially expressed miRNAs.

