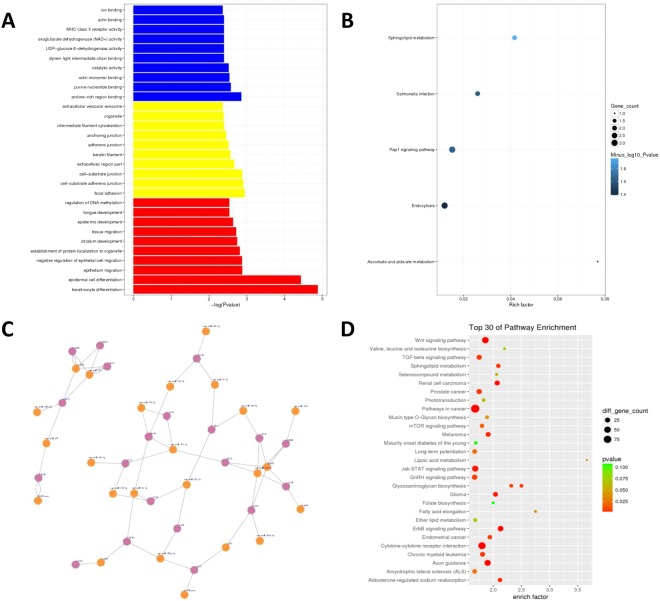
Figure 5.
Annotation of differentially expressed circRNAs. (A)Most significantly enriched GO (−log10 (P value)) terms of miRNAs gene symbols according to biological process, marked red; cellular component, marked yellow; molecular function, marked blue. (B) KEGG pathway enrichment analysis of up and down regulated miRNAs. (C) Prediction of interaction networks between differentially expressed miRNAs and circRNAs. (D) Annotation of miRNA targets, KEGG pathway enrichment analysis of the mRNA targets of dysregulated miRNAs.

