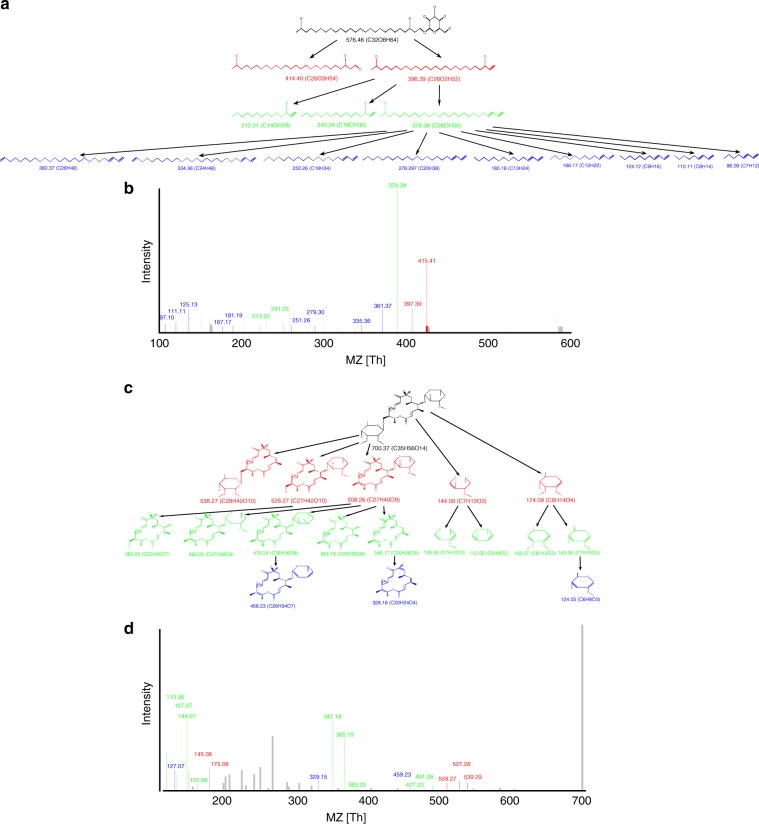
Fig. 9.
Annotating the fragmentation graph. The MSM formed by the fragmentation graph of a heterocyst glycolipid, and b its spectrum. While only 2 and 3 peaks out of 44 peaks in heterocyst glycolipid mass spectra get annotated at depths 1 and 2, respectively (shown in red and green), 9 peaks get annotated at depth 3 (shown in blue), resulting in a score of 2 + 3 + 9 = 14. c The MSM formed by the fragmentation graph of c chalcomycin, and d its mass spectrum. 5, 9, and 3 out of 42 peaks in chalcomycin spectrum are annotated at depth 1, 2, and 3, respectively, resulting in a score of 5 + 9 + 3 = 17

