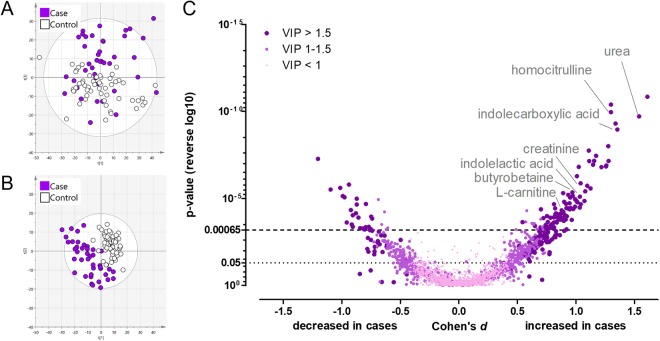
Figure 1.
Overview of the metabolite profiling results from the cord plasma samples.Total of 2401 molecular features were observed from the cord plasma samples. Panel A is showing the first and third component of a principal component analysis (PCA). Total of 77 component were needed to cumulatively explain 95% of the variance in the data. Panel B shows first two components of a partial-least-squares discriminant-analysis (PLS-DA). In the PLS-DA model (B), five components cumulatively explain 96% of the variance in the data between the groups. These five components are able to predict 57% of the data (leave-one-out cross-validation). Panel C shows the p-values (Student’s t-test), Cohen’s d effect sizes and VIP-values (from PLS-DA) of all molecular features. Total of 133 molecular features were significantly altered between newborns of PE and non-PE women after correction for multiple testing (adjusted α level = 0.00065, Bonferroni’s correction).

