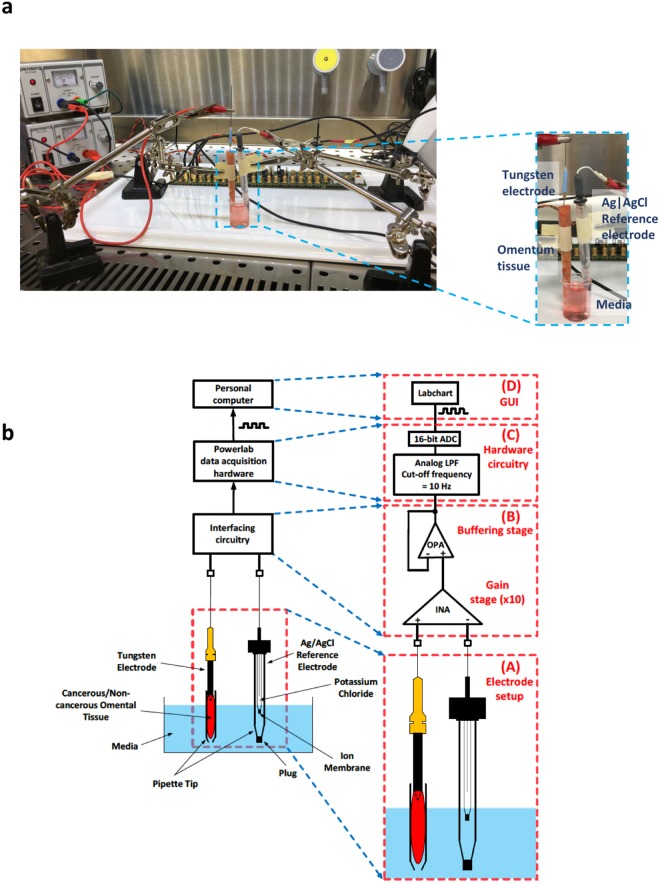
Figure 1.
Laboratory set up for recording of biopotential readings. (a) Experimental laboratory set up for recording of biopotential measurements in a sterile laminar flow cabinet, measurements are recorded using Labchart software on a laptop set up outside the laminar flow cabinet. Inset shows the tungsten working electrode inserted in a piece of non-cancerous omentum tissue and partly submerged in media. The Ag|AgCl reference electrode is also placed in a 1 ml pipette tip which is partly submerged in the same media beaker. (b) Developed methodology for recording of tissue biopotential readings. The analog voltage difference, present between a tungsten electrode that pierces the human tissue and a Ag|AgCl reference electrode submerged in cell culture medium solution, is recorded by means of an interfacing circuitry. The output of the interfacing circuitry is processed by a commercially available data acquisition system (Powerlab data acquisition hardware) and is depicted on the computer screen. (A) Detailed view of the electrochemical cell. Both the Ag|AgCl reference electrode and the tissue sample are in contact with cell culture medium solution. The tip of the tungsten electrode (dashed line) pierces the cancerous/non-cancerous tissue sample but does not make contact with the medium solution. This ensures that the voltage measurement is taken from the tissue sample and not from the medium solution. (B) Detailed view of the interfacing circuitry. It consists of a high-performance instrumentation amplifier (INA), which amplifies the voltage difference between the tungsten and the Ag|AgCl double junction reference electrode, and an operational amplifier (OPA) connected as a voltage follower, which acts as a buffering stage between the interfacing circuitry and the following stage (Powerlab data acquisition hardware). (C) Detailed view of the commercially available Powerlab data acquisition hardware. The amplified signal coming from the interfacing circuitry is low-pass filtered (LPF) with the cut-off frequency set at 10 Hz. Next, the filtered signal is digitized by a 16-bit analog-to-digital converter (ADC). (D) The digital signal is depicted on the computer screen using the graphical user interface (GUI) offered by the Powerlab system (Labchart).

