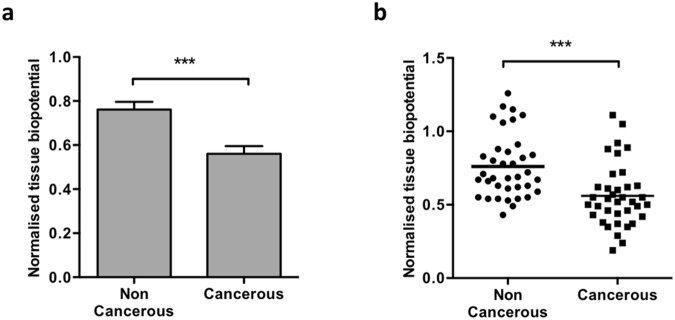
Figure 2.
Biopotential levels differ between paired cancerous and non-cancerous tissues. (a) Biopotential data captured in the laboratory 45–120 min post removal on excised, paired omentum samples with macroscopically non-cancerous and cancerous appearance in different areas of the tissues. All biopotential readings were measured in triplicate and normalized to a reference media reading. Across the patient series, lower biopotential readings were observed for all cancerous samples compared to its paired non-cancerous counterpart (p < 0.001, n = 36). (b) A range of biopotential readings were collected across the patient series (each dot represents the mean of each tissue’s biopotential) for all tissues collected, consistently cancerous tissue had a lower biopotential than its non-cancerous pair (p < 0.001, n = 36).

