Fig. 2.
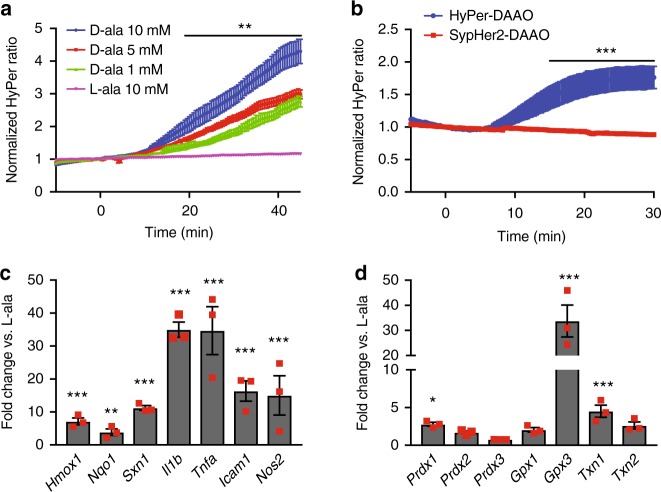
Fluorescence time course of DAAO activation and in vitro transcriptional responses. a Pooled ratiometric fluorescent data from myocytes treated with 1 mM (green triangles, n = 20 cells), 5 mM (red squares, n = 20 cells), or 10 mM (blue circles, n = 9 cells) D- alanine or 10 mM L-alanine (purple inverted triangles, n = 14 cells) for 45 min. Ratios are normalized to the HyPer ratio prior at time t = 0. **p < 0.01 by two-way ANOVA with Bonferroni correction for multiple comparisons for L- vs. D-alanine. b Ratiometric fluorescence time courses of human IPS-derived cardiac myocytes expressing HyPer-DAAO (blue circles, n = 9 cells) or SypHer2-DAAO (pH control construct; red squares, n = 13 cells) treated with D-alanine (10 mM). ***p < 0.001 by two-way ANOVA with Bonferroni correction for multiple comparisons. c Changes in expression of the Nrf2 transcriptional targets Hmox1, Nqo1, and Sxn1 and the NF-κB transcriptional targets Il1b, Tnfa, Icam1, and Nos2 in cardiac myocytes isolated from rats expressing DAAO and then treated with 10 mM D- vs. L-alanine for 120 min. Distributions for control samples treated with L-alanine can be found on Supplementary Figure 3A. d Relative changes in expression of the redox-active enzymes Prdx1, Prdx2, Prdx3, Gpx1, Gpx3, Txn1, and Txn2 in response to 10 mM D- vs. L-alanine, analyzed in cardiac myocytes isolated from rats infected with DAAO. Distributions for control samples treated with L-alanine can be found on Supplementary Figure 3B. *p < 0.05, **p < 0.01, and ***p < 0.001 D- vs. L-alanine by ANOVA. Data are represented as mean ± standard error

