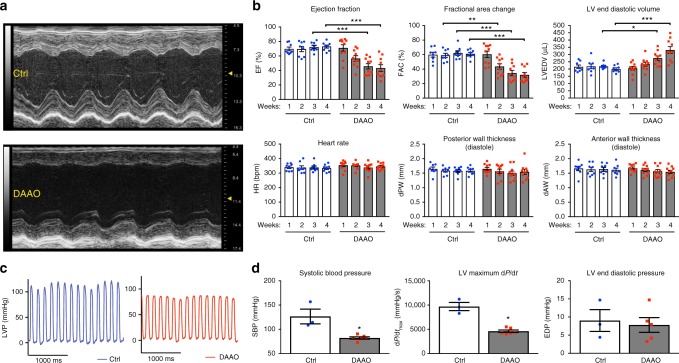
Fig. 3.
Echocardiographic and intracardiac pressure parameters after chronic activation of DAAO. a Representative M-mode images from short-axis views of the left ventricle of rats infected with control (Ctrl) or DAAO virus and treated with D-alanine in their drinking water for 4 weeks. b Left ventricular echocardiographic parameters over the 4 weeks of oral D-alanine treatment in rats expressing DAAO (red squares) vs. control animals (blue circles). *p < 0.05, **p < 0.01, and ***p < 0.001 by ANOVA. c Representative left ventricular (LV) pressure traces of Ctrl and DAAO-infected rats after 4 weeks of oral D-alanine treatment. d Pooled LV pressure parameters after 4 weeks of treatment. *p < 0.05 by Mann–Whitney U test. Data are represented as mean ± standard error

