Figure 1.
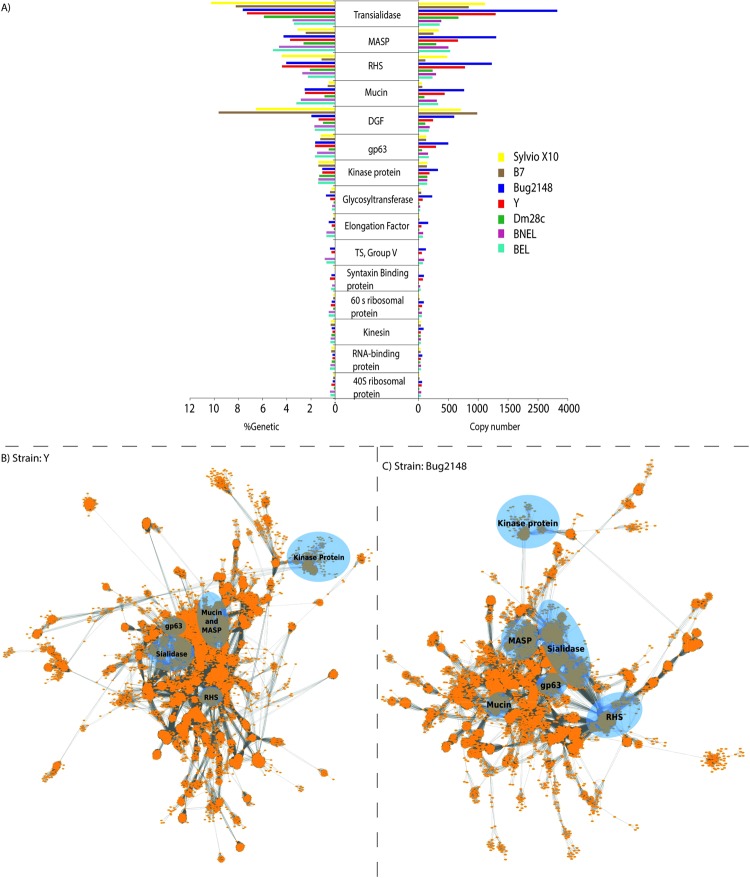
Protein families in T. cruzi. (A) On the left, the genetic percent that represents the gene copy number found (for the top 15) based on the total annotated genes of Y and Bug2148 and public available genomes. On the right, the copy number for these genes along the entire genome. (B) Gene families clustering for the Y strain including hypothetical proteins. (C) Gene families clustering for the Bug2148 strain including hypothetical proteins. Most abundant families are remarked by blue circles.

