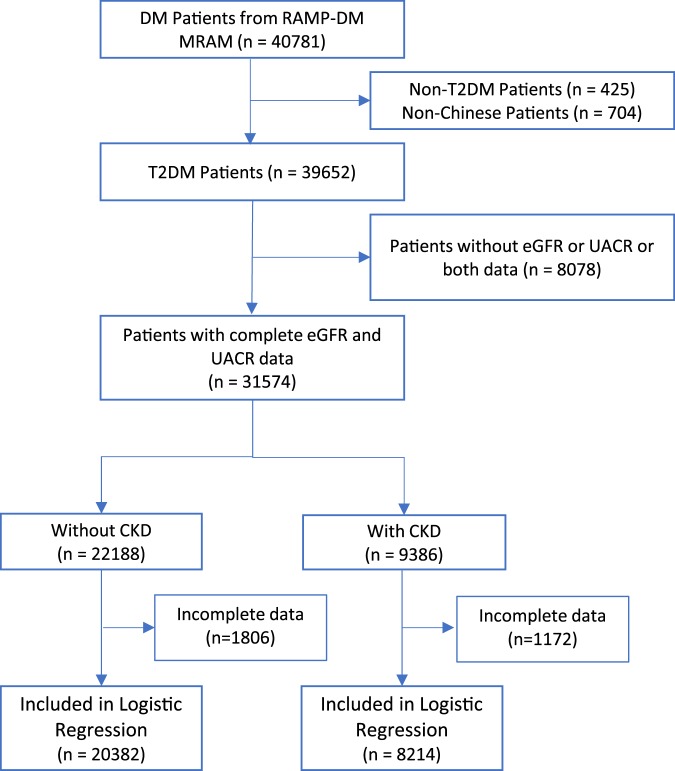
Figure 1.
Flow chart of data extraction and analysis. Incomplete data refer to missing in at least one of the following variables: sex, age, DM duration, education, smoking, alcohol drinking, SBP, DBP, hypertension, BMI categories, CHD, stroke, PAD, DR status, HbA1c, HDL-C, LDL-C, TG, receiving CSSA.

