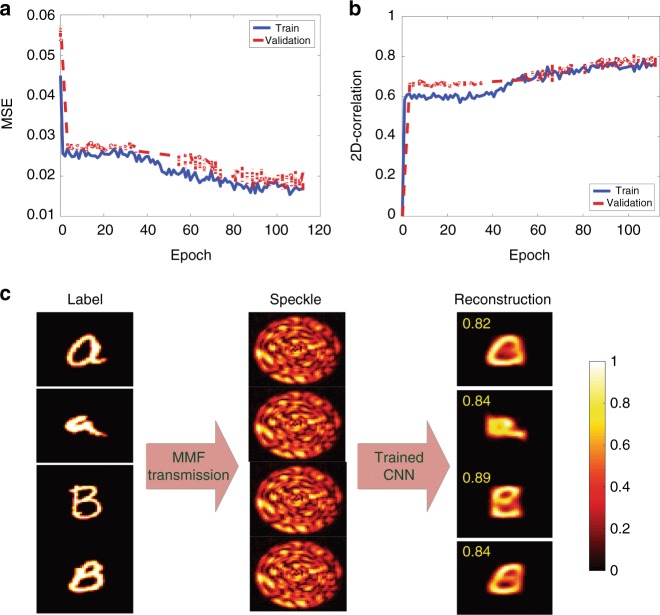
Fig. 2. Amplitude-to-phase inversion.
Performance of the network in reconstructing the input phases from the output amplitude speckle patterns when the CNN is trained with the handwritten Latin alphabet. The speckle pattern for each letter image is obtained using the transmission matrix of the system. Calculated (a) MSE and (b) 2D-correlation for the train/validation data sets. c Examples of the output amplitude speckle patterns and the reconstructed fiber input phase patterns produced via the CNN. The fidelity number for each reconstructed image with respect to its corresponding grayscale label is shown

