Fig. 4.
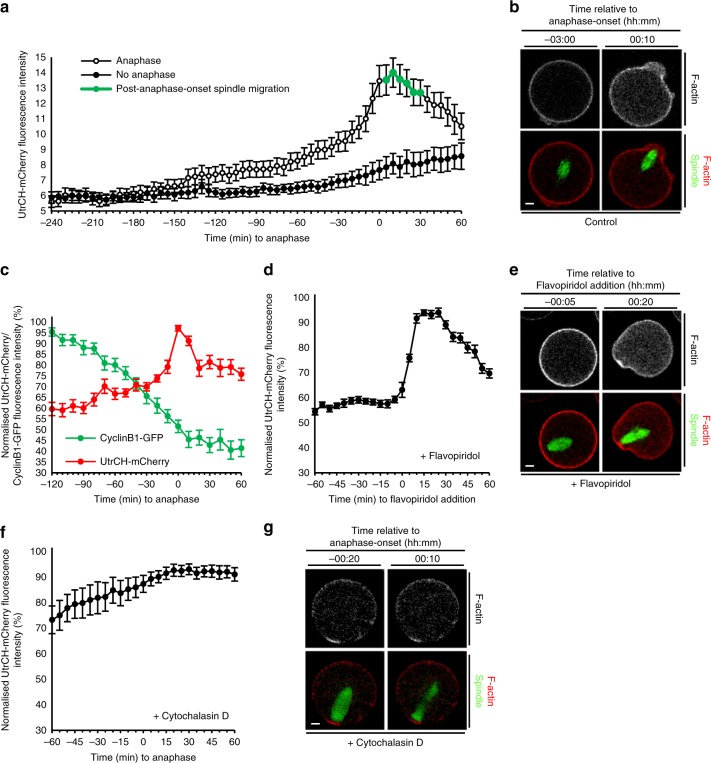
Cdk1 inactivation induces increased F-actin required for spindle migration. a Cytoplasmic UtrCH-mCherry intensity in live oocytes relative to anaphase-onset. Shown is a representative replicate in which absolute intensity was determined for oocytes from the same experiment exposed to identical imaging parameters that either underwent anaphase (n = 24) or not (no anaphase; n = 11). Note that spindle migration (green markers) occurs coincidently with the F-actin spike. b Increased cytoplasmic F-actin coincident with anaphase-onset (see Supplementary Movie 21). c UtrCH-mCherry and Cyclin B1-GFP fluorescence relative to anaphase-onset in oocytes co-expressing both constructs (n = 11). d, e UtrCH-mCherry fluorescence changes following the addition of flavopiridol at 4 h post-GVBD (n = 15; see Supplementary Movie 22). f, g UtrCH-mCherry fluorescence following cytochalasin D treatment from 6 h post-GVBD (n = 11). Note the absence of migration and protrusion following anaphase-onset (see Supplementary Movie 23). Times in panels are hours:minutes relative to anaphase-onset (b, g) and to flavopiridol addition (e), respectively. Scale bars, 10 µm. All error bars are mean ± SEM

