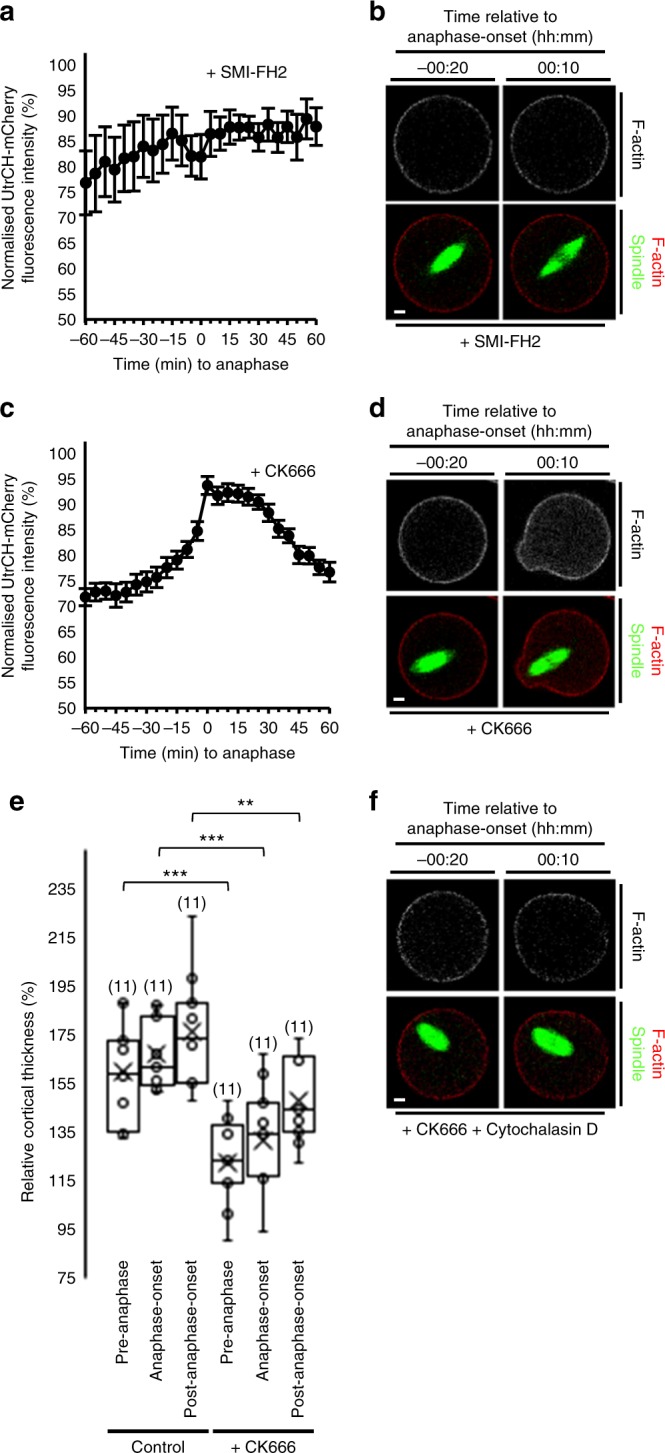
Fig. 5.

Increased cytoplasmic F-actin is required for spindle migration. a, b UtrCH-mCherry fluorescence changes following treatment with SMI-FH2 from 6 h post-GVBD (n = 10). Note the absence of migration and protrusion following anaphase-onset. c, d Cytoplasmic UtrCH-mCherry fluorescence changes in relation to anaphase-onset following CK666 treatment from 6 h post-GVBD (n = 19; see Supplementary Movie 24). Error bars are mean ± SEM (a, c). e Cortical UtrCH-mCherry fluorescence intensity within the protrusion in relation to anaphase-onset for control and CK666-treated oocytes. Box plots depict median (horizontal line), mean (crosses), 25th and 75th percentiles (boxes) and 5th and 95th percentiles (whiskers). One-way ANOVA used for statistical analysis. P values represented as **P < 0.01 and ***P < 0.001. f Lack of anaphase-onset-related increase in UtrCH-mCherry fluorescence following co-treatment with CK666+cytochalasin D from 6 h post-GVBD. Times in panels are hours:minutes relative to anaphase-onset. Scale bars, 10 µm. Oocyte numbers are shown in parentheses from a minimum of three independent experiments
